Wells Fargo 2007 Annual Report Download - page 59
Download and view the complete annual report
Please find page 59 of the 2007 Wells Fargo annual report below. You can navigate through the pages in the report by either clicking on the pages listed below, or by using the keyword search tool below to find specific information within the annual report.-
 1
1 -
2
-
3
-
4
-
5
-
6
-
7
-
8
-
9
-
10
-
11
-
12
-
13
-
14
-
15
-
16
-
17
-
18
-
19
-
20
-
21
-
22
-
23
-
24
-
25
-
26
-
27
-
28
-
29
-
30
-
31
-
32
-
33
-
34
-
35
-
36
-
37
-
38
-
39
-
40
-
41
-
42
-
43
-
44
-
45
-
46
-
47
-
48
-
 49
49 -
 50
50 -
 51
51 -
 52
52 -
 53
53 -
 54
54 -
 55
55 -
 56
56 -
 57
57 -
 58
58 -
 59
59 -
 60
60 -
 61
61 -
 62
62 -
 63
63 -
 64
64 -
 65
65 -
 66
66 -
 67
67 -
 68
68 -
 69
69 -
70
-
71
-
72
-
73
-
74
-
75
-
76
-
77
-
78
-
79
-
80
-
81
-
82
-
83
-
84
-
85
-
86
-
87
-
88
-
89
-
90
-
91
-
92
-
93
-
94
-
95
-
96
-
97
-
98
-
99
-
100
-
101
-
102
-
103
-
104
-
105
-
106
-
107
-
108
-
109
-
110
-
111
-
112
-
113
-
114
-
115
-
116
-
117
-
118
-
119
-
120
-
121
-
122
-
123
-
124
-
125
-
126
-
127
-
128
-
129
-
130
-
131
-
132
-
133
-
134
-
135
-
136
 |
 |

56
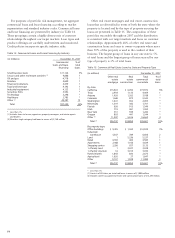
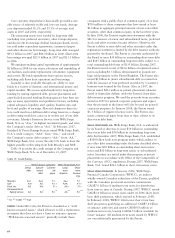
Table 15: Commercial Real Estate Loans by State and Property Type
(in millions) December 31, 2007
Other real Real Total % of
estate estate commercial total
mortgage construction real estate loans
By state:
California $13,922 $ 6,050 $19,972 5%
Texas 2,934 1,135 4,069 1
Arizona 1,926 1,262 3,188 *
Colorado 1,669 873 2,542 *
Washington 1,441 652 2,093 *
Minnesota 1,319 382 1,701 *
Florida 636 913 1,549 *
Utah 719 581 1,300 *
New York 331 949 1,280 *
Oregon 803 441 1,244 *
Other (1) 11,047 5,616 16,663 4
Total (2) $36,747 $18,854 $55,601 15%
By property type:
Office buildings $ 9,435 $ 1,500 $10,935 3%
Industrial/
warehouse 5,817 789 6,606 2
Land 1 5,236 5,237 1
Retail 4,183 400 4,583 1
Apartments 2,468 1,166 3,634 1
Shopping center 2,206 927 3,133 *
1-4 family land 1 3,037 3,038 *
1-4 family structure 16 3,014 3,030 *
Hotels/motels 1,843 830 2,673 *
Agricultural 1,620 27 1,647 *
Other 9,157 1,928 11,085 3
Total (2) $36,747 $18,854 $55,601 15%
* Less than 1%.
(1) Consists of 40 states; no state had loans in excess of $1,000 million.
(2) Includes owner-occupied real estate and construction loans of $15,295 million.
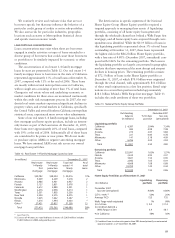
For purposes of portfolio risk management, we aggregate
commercial loans and lease financing according to market
segmentation and standard industry codes. Commercial loans
and lease financing are presented by industry in Table 14.
These groupings contain a highly diverse mix of customer
relationships throughout our target markets. Loan types and
product offerings are carefully underwritten and monitored.
Credit policies incorporate specific industry risks.
Other real estate mortgages and real estate construction
loans that are diversified in terms of both the state where the
property is located and by the type of property securing the
loans are presented in Table 15. The composition of these
portfolios was stable throughout 2007 and the distribution
is consistent with our target markets and focus on customer
relationships. Approximately 28% of other real estate and
construction loans are loans to owner-occupants where more
than 50% of the property is used in the conduct of their
business. The largest group of loans in any one state is 5%
of total loans and the largest group of loans secured by one
type of property is 3% of total loans.
Table 14: Commercial Loans and Lease Financing by Industry
(in millions) December 31, 2007
Commercial % of
loans and lease total
financing loans
Small business loans $11,126 3%
Lessors and other real estate activities (1) 4,888 1
Oil and gas 4,718 1
Retailers 4,699 1
Financial institutions 4,479 1
Food and beverage 4,145 1
Industrial equipment 4,123 1
Securities firms 3,592 *
Technology 3,298 *
Healthcare 2,785 *
Other (2) 49,387 13
Total $97,240 25%
* Less than 1%.
(1) Includes loans to lessors, appraisers, property managers, real estate agents
and brokers.
(2) No other single category had loans in excess of $2,748 million.