Wells Fargo 2007 Annual Report Download - page 61
Download and view the complete annual report
Please find page 61 of the 2007 Wells Fargo annual report below. You can navigate through the pages in the report by either clicking on the pages listed below, or by using the keyword search tool below to find specific information within the annual report.-
 1
1 -
2
-
3
-
4
-
5
-
6
-
7
-
8
-
9
-
10
-
11
-
12
-
13
-
14
-
15
-
16
-
17
-
18
-
19
-
20
-
21
-
22
-
23
-
24
-
25
-
26
-
27
-
28
-
29
-
30
-
31
-
32
-
33
-
34
-
35
-
36
-
37
-
38
-
39
-
40
-
41
-
42
-
43
-
44
-
45
-
46
-
47
-
48
-
49
-
50
-
 51
51 -
 52
52 -
 53
53 -
 54
54 -
 55
55 -
 56
56 -
 57
57 -
 58
58 -
 59
59 -
 60
60 -
 61
61 -
 62
62 -
 63
63 -
 64
64 -
 65
65 -
 66
66 -
 67
67 -
 68
68 -
 69
69 -
 70
70 -
 71
71 -
72
-
73
-
74
-
75
-
76
-
77
-
78
-
79
-
80
-
81
-
82
-
83
-
84
-
85
-
86
-
87
-
88
-
89
-
90
-
91
-
92
-
93
-
94
-
95
-
96
-
97
-
98
-
99
-
100
-
101
-
102
-
103
-
104
-
105
-
106
-
107
-
108
-
109
-
110
-
111
-
112
-
113
-
114
-
115
-
116
-
117
-
118
-
119
-
120
-
121
-
122
-
123
-
124
-
125
-
126
-
127
-
128
-
129
-
130
-
131
-
132
-
133
-
134
-
135
-
136
 |
 |

58
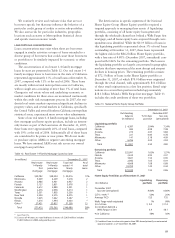
LOANS 90 DAYS OR MORE PAST DUE AND STILL ACCRUING
Loans included in this category are 90 days or more past due
as to interest or principal and still accruing, because they are
(1) well-secured and in the process of collection or (2) real
estate 1-4 family first mortgage loans or consumer loans
exempt under regulatory rules from being classified as
nonaccrual.
The total of loans 90 days or more past due and still
accruing was $6,393 million, $5,073 million, $3,606 million,
$2,578 million and $2,337 million at December 31, 2007,
2006, 2005, 2004 and 2003, respectively. The total included
$4,834 million, $3,913 million, $2,923 million, $1,820 million
and $1,641 million for the same periods, respectively, in
advances pursuant to our servicing agreements to GNMA
mortgage pools whose repayments are insured by the FHA
or guaranteed by the Department of Veterans Affairs. Table
17 reflects loans 90 days or more past due and still accruing
excluding the insured/guaranteed GNMA advances.
either internal loan examiners or regulatory examiners. The
detail of the changes in the allowance for credit losses, including
charge-offs and recoveries by loan category, is in Note 6 (Loans
and Allowance for Credit Losses) to Financial Statements.
At December 31, 2007, the allowance for loan losses
was $5.31 billion (1.39% of total loans), compared with
$3.76 billion (1.18%), at December 31, 2006. The allowance
for credit losses was $5.52 billion (1.44% of total loans)
at December 31, 2007, and $3.96 billion (1.24%) at
December 31, 2006. These ratios fluctuate from period to
period and the increase in the ratios of the allowance for
loan losses and the allowance for credit losses to total loans
in 2007 was primarily due to the $1.4 billion credit reserve
build in 2007. Until 2007 we had historically experienced
the lowest charge-offs on our residential real estate secured
consumer loan portfolio. In 2007, net charge-offs in the Home
Equity portfolio increased due to a severe decline in housing
prices in several of our major geographic markets. The
increased level of loss content in the Home Equity portfolio
was the primary driver of the $1.4 billion increase to the
allowance for loan losses. The reserve for unfunded credit
commitments was $211 million at December 31, 2007, and
$200 million at December 31, 2006.
The ratio of the allowance for credit losses to total nonac-
crual loans was 206% and 238% at December 31, 2007 and
2006, respectively. This ratio may fluctuate significantly from
period to period due to such factors as the mix of loan types
in the portfolio, borrower credit strength and the value and
marketability of collateral. Over half of nonaccrual loans
were home mortgages, auto and other consumer loans at
December 31, 2007. Nonaccrual loans are generally written
down to fair value less cost to sell at the time they are placed
on nonaccrual and accounted for on a cost recovery basis.
The provision for credit losses totaled $4.94 billion in
2007, $2.20 billion in 2006 and $2.38 billion in 2005. In
2007, the provision included $1.4 billion in excess of net
charge-offs, which was our estimate of the increase in
incurred losses in our loan portfolio at year-end 2007,
primarily related to the Home Equity portfolio.
Net charge-offs in 2007 were 1.03% of average total
loans, compared with 0.73% in 2006 and 0.77% in 2005.
Net charge-offs for 2007 in the Home Equity portfolio were
$595 million (0.73% of average loans), a $485 million
increase from $110 million (0.14%) for 2006. The increase
was primarily due to loans in geographic markets that have
experienced the most abrupt and steepest declines in housing
prices. Because the majority of the Home Equity net charge-
offs were concentrated in the indirect or third party origina-
tion channels, which have a higher percentage of 90% or
greater combined loan-to-value portfolios, we have discon-
tinued third party activities not behind a Wells Fargo first
mortgage and segregated these loans into a liquidating
portfolio. As previously disclosed, while the $11.9 billion of
loans in this liquidating portfolio represented about 3% of
total loans outstanding at December 31, 2007, these loans
represent the highest risk in our $84.2 billion Home Equity
portfolio. The loans in the liquidating portfolio were primarily
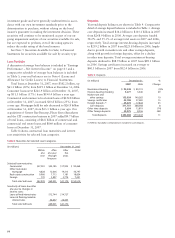
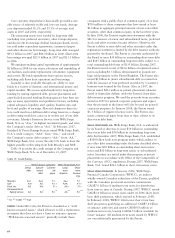
Table 17: Loans 90 Days or More Past Due and Still Accruing
(Excluding Insured/Guaranteed GNMA Advances)
(in millions) December 31,
2007 2006 2005 2004 2003
Commercial and
commercial real estate:
Commercial $32 $ 15 $ 18 $ 26 $ 87
Other real estate
mortgage 10 313 6 9
Real estate construction 24 3 9 6 6
Total commercial
and commercial
real estate 66 21 40 38 102
Consumer:
Real estate
1-4 family
first mortgage (1) 286 154 103 148 117
Real estate
1-4 family junior
lien mortgage 201 63 50 40 29
Credit card 402 262 159 150 134
Other revolving credit
and installment 552 616 290 306 271
Total consumer 1,441 1,095 602 644 551
Foreign 52 44 41 76 43
Total $1,559 $1,160 $683 $758 $696
(1) Includes mortgage loans held for sale 90 days or more past due and still accruing.
ALLOWANCE FOR CREDIT LOSSES
The allowance for credit losses, which consists of the allowance
for loan losses and the reserve for unfunded credit commit-
ments, is management’s estimate of credit losses inherent in
the loan portfolio at the balance sheet date. We assume that
our allowance for credit losses as a percentage of charge-offs
and nonaccrual loans will change at different points in time
based on credit performance, loan mix and collateral values.
Any loan with past due principal or interest that is not both
well-secured and in the process of collection generally is charged
off (to the extent that it exceeds the fair value of any related
collateral) based on loan category after a defined period of
time. Also, a loan is charged off when classified as a loss by