Wells Fargo 2007 Annual Report Download - page 119
Download and view the complete annual report
Please find page 119 of the 2007 Wells Fargo annual report below. You can navigate through the pages in the report by either clicking on the pages listed below, or by using the keyword search tool below to find specific information within the annual report.-
 1
1 -
2
-
3
-
4
-
5
-
6
-
7
-
8
-
9
-
10
-
11
-
12
-
13
-
14
-
15
-
16
-
17
-
18
-
19
-
20
-
21
-
22
-
23
-
24
-
25
-
26
-
27
-
28
-
29
-
30
-
31
-
32
-
33
-
34
-
35
-
36
-
37
-
38
-
39
-
40
-
41
-
42
-
43
-
44
-
45
-
46
-
47
-
48
-
49
-
50
-
51
-
52
-
53
-
54
-
55
-
56
-
57
-
58
-
59
-
60
-
61
-
62
-
63
-
64
-
65
-
66
-
67
-
68
-
69
-
70
-
71
-
72
-
73
-
74
-
75
-
76
-
77
-
78
-
79
-
80
-
81
-
82
-
83
-
84
-
85
-
86
-
87
-
88
-
89
-
90
-
91
-
92
-
93
-
94
-
95
-
96
-
97
-
98
-
99
-
100
-
101
-
102
-
103
-
104
-
105
-
106
-
107
-
108
-
 109
109 -
 110
110 -
 111
111 -
 112
112 -
 113
113 -
 114
114 -
 115
115 -
 116
116 -
 117
117 -
 118
118 -
 119
119 -
 120
120 -
 121
121 -
 122
122 -
 123
123 -
 124
124 -
 125
125 -
 126
126 -
 127
127 -
 128
128 -
 129
129 -
130
-
131
-
132
-
133
-
134
-
135
-
136
 |
 |

116
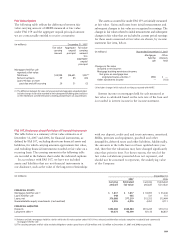
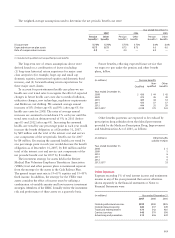
The table below provides information for pension plans
with benefit obligations in excess of plan assets, substantially
due to our nonqualified pension plans.
(in millions) December 31,
2007 2006
Projected benefit obligation $463 $399
Accumulated benefit obligation 422 345
Fair value of plan assets 88 70
The accumulated benefit obligation for the defined benefit
pension plans was $4,734 million and $4,550 million at
December 31, 2007 and 2006, respectively.
We seek to achieve the expected long-term rate of return
with a prudent level of risk given the benefit obligations of
the pension plans and their funded status. We target the
Cash Balance Plan’s asset allocation for a target mix range of
40–70% equities, 20–50% fixed income, and approximately
10% in real estate, venture capital, private equity and other
investments. The target ranges referenced above account for
the employment of an asset allocation methodology designed
to overweight stocks or bonds when a compelling opportunity
exists. The Employee Benefit Review Committee (EBRC),
which includes several members of senior management,
formally reviews the investment risk and performance of
the Cash Balance Plan on a quarterly basis. Annual Plan
liability analysis and periodic asset/liability evaluations are
also conducted.
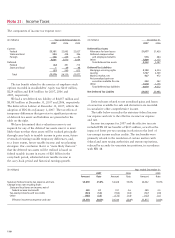
The components of net periodic benefit cost were:
(in millions) Year ended December 31,
2007 2006 2005
Pension benefits Pension benefits Pension benefits
Non- Other Non- Other Non- Other
Qualified qualified benefits Qualified qualified benefits Qualified qualified benefits
Service cost $ 281 $ 15 $ 15 $ 247 $16 $ 15 $ 208 $21 $ 21
Interest cost 246 18 41 224 16 39 220 14 41
Expected return
on plan assets (452) — (36) (421) — (31) (393) — (25)
Amortization of
net actuarial loss (1) 32 13 5 5665 6836
Amortization of
prior service cost —(3)(4) — (1) (4) (4) (2) (1)
Special termination benefits ——— 2—— ———
Curtailment gain ——— —— (9) ———
Settlement 1 — — 5 3 — — — —
Net periodic benefit cost 108 43 21 $ 113 $40 $ 15 $ 99 $36 $ 42
Other changes in
plan assets and
benefit obligations
recognized in other
comprehensive income:
Net actuarial loss (gain) (213) 16 (126)
Amortization of net
actuarial loss (33) (13) (5)
Prior service cost — (24) —
Amortization of prior
service cost —34
Translation adjustments 3 — 2
Total recognized in other
comprehensive income (243) (18) (125)
Total recognized in
net periodic benefit
cost and other
comprehensive income $(135) $ 25 $(104)
(1) Net actuarial loss is generally amortized over five years.
The weighted-average allocation of plan assets was:
Percentage of plan assets at December 31,
2007 2006
Pension Other Pension Other
plan benefit plan benefit
assets plan assets assets plan assets
Equity securities 67% 63% 70% 62%
Debt securities 26 34 24 35
Real estate 42 42
Other 3 1 2 1
Total 100% 100% 100% 100%