Wells Fargo 2007 Annual Report Download - page 50
Download and view the complete annual report
Please find page 50 of the 2007 Wells Fargo annual report below. You can navigate through the pages in the report by either clicking on the pages listed below, or by using the keyword search tool below to find specific information within the annual report.-
 1
1 -
2
-
3
-
4
-
5
-
6
-
7
-
8
-
9
-
10
-
11
-
12
-
13
-
14
-
15
-
16
-
17
-
18
-
19
-
20
-
21
-
22
-
23
-
24
-
25
-
26
-
27
-
28
-
29
-
30
-
31
-
32
-
33
-
34
-
35
-
36
-
37
-
38
-
39
-
 40
40 -
 41
41 -
 42
42 -
 43
43 -
 44
44 -
 45
45 -
 46
46 -
 47
47 -
 48
48 -
 49
49 -
 50
50 -
 51
51 -
 52
52 -
 53
53 -
 54
54 -
 55
55 -
 56
56 -
 57
57 -
 58
58 -
 59
59 -
 60
60 -
61
-
62
-
63
-
64
-
65
-
66
-
67
-
68
-
69
-
70
-
71
-
72
-
73
-
74
-
75
-
76
-
77
-
78
-
79
-
80
-
81
-
82
-
83
-
84
-
85
-
86
-
87
-
88
-
89
-
90
-
91
-
92
-
93
-
94
-
95
-
96
-
97
-
98
-
99
-
100
-
101
-
102
-
103
-
104
-
105
-
106
-
107
-
108
-
109
-
110
-
111
-
112
-
113
-
114
-
115
-
116
-
117
-
118
-
119
-
120
-
121
-
122
-
123
-
124
-
125
-
126
-
127
-
128
-
129
-
130
-
131
-
132
-
133
-
134
-
135
-
136
 |
 |

47
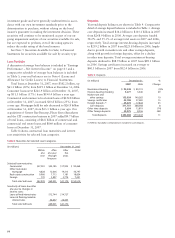
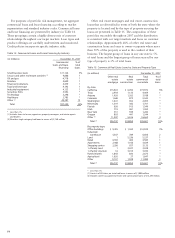
Mortgage banking noninterest income was $3,133 million
in 2007, compared with $2,311 million in 2006. Servicing fees,
included in net servicing income, increased to $4,025 million
in 2007 from $3,525 million in 2006, due to growth in loans
serviced for others, primarily reflecting the full year effect of
the $140 billion servicing portfolio acquired from Washington
Mutual, Inc. in July 2006. Our portfolio of loans serviced for
others was $1.43 trillion at December 31, 2007, up 12% from
$1.28 trillion at December 31, 2006. Servicing income also
includes both changes in the fair value of MSRs during the
period as well as changes in the value of derivatives (economic
hedges) used to hedge the MSRs. Net servicing income for
2007 included a $583 million net MSRs valuation gain that
was recorded to earnings ($571 million fair value loss offset
by a $1.15 billion economic hedging gain) and for 2006
included a $154 million net MSRs valuation loss ($9 million
fair value loss plus a $145 million economic hedging loss).
At December 31, 2007, the ratio of MSRs to related loans
serviced for others was 1.20%, the lowest ratio in 10 quarters.
Net gains on mortgage loan origination/sales activities were
$1,289 million in 2007, up from $1,116 million in 2006.
Gains for 2007 were partly offset by losses of $803 million,
which consisted of a $479 million write-down of the mortgage
warehouse/pipeline, and a $324 million write-down primarily
due to mortgage loans repurchased and an increase in the
repurchase reserve for projected early payment defaults.
During 2006, we realized losses of $126 million resulting
from the sale of low yielding ARMs as part of our balance
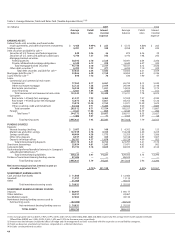
Table 5: Noninterest Income
(in millions) Year ended December 31, % Change
2007 2006 2005 2007/ 2006/
2006 2005
Service charges on
deposit accounts $ 3,050 $ 2,690 $ 2,512
13% 7%
Trust and investment fees:
Trust, investment and IRA fees 2,305 2,033 1,855
13 10
Commissions and all other fees
844 704 581 20 21
Total trust and
investment fees
3,149 2,737 2,436 15 12
Card fees
2,136 1,747 1,458 22 20
Other fees:
Cash network fees
193 184 180 52
Charges and fees on loans
1,011 976 1,022 4(5)
All other fees
1,088 897 727 21 23
Total other fees
2,292 2,057 1,929 11 7
Mortgage banking:
Servicing income, net
1,511 893 987 69 (10)
Net gains on mortgage loan
origination/sales activities
1,289 1,116 1,085 16 3
All other
333 302 350 10 (14)
Total mortgage banking
3,133 2,311 2,422 36 (5)
Operating leases
703 783 812 (10) (4)
Insurance
1,530 1,340 1,215 14 10
Net gains from trading activities
544 544 571 —(5)
Net gains (losses) on debt
securities available for sale
209 (19) (120) NM (84)
Net gains from
equity investments
734 738 511 (1) 44
All other
936 812 699 15 16
Total
$18,416 $15,740 $14,445 17 9
NM – Not meaningful
sheet repositioning strategy. Residential real estate originations
totaled $272 billion in 2007, compared with $294 billion in
2006. Under FAS 159 we elected in 2007 to account for new
prime MHFS at fair value. These loans are initially measured
at fair value, with subsequent changes in fair value recognized
as a component of net gains on mortgage loan origination/sales
activities. Prior to the adoption of FAS 159, these fair value
gains would have been deferred until the sale of these loans.
(For additional detail, see “Asset/Liability and Market Risk
Management – Mortgage Banking Interest Rate and Market
Risk,” and Note 1 (Summary of Significant Accounting Policies),
Note 9 (Mortgage Banking Activities) and Note 17 (Fair Values
of Assets and Liabilities) to Financial Statements.) The 1-4
family first mortgage unclosed pipeline was $43 billion at
December 31, 2007 and $48 billion at December 31, 2006.
Insurance revenue was up 14% from 2006, due to higher
insurance commissions and increases in crop insurance premiums.
Income from trading activities was $544 million in both
2007 and 2006. Net gains on debt securities were $209 million
for 2007, compared with losses of $19 million for 2006. Net
gains from equity investments were $734 million in 2007,
compared with $738 million in 2006.
We routinely review our investment portfolios and recognize
impairment write-downs based primarily on fair market value,
issuer-specific factors and results, and our intent to hold such
securities to recovery. We also consider general economic and
market conditions, including industries in which venture capital
investments are made, and adverse changes affecting the
availability of venture capital. We determine other-than-tem-
porary impairment based on the information available at the
time of the assessment, with particular focus on the severity
and duration of specific security impairments, but new infor-
mation or economic developments in the future could result
in recognition of additional impairment.
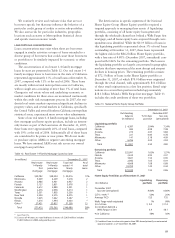
Noninterest Expense
Table 6: Noninterest Expense
(in millions) Year ended December 31, % Change
2007 2006 2005 2007/ 2006/
2006 2005
Salaries $ 7,762 $ 7,007 $ 6,215 11% 13%
Incentive compensation 3,284 2,885 2,366 14 22
Employee benefits 2,322 2,035 1,874 14 9
Equipment 1,294 1,252 1,267 3(1)
Net occupancy 1,545 1,405 1,412 10 —
Operating leases 561 630 635 (11) (1)
Outside professional services 899 942 835 (5) 13
Outside data processing 482 437 449 10 (3)
Travel and entertainment 474 542 481 (13) 13
Contract services 448 579 596 (23) (3)
Operating losses 437 275 194 59 42
Insurance 416 257 224 62 15
Advertising and promotion 412 456 443 (10) 3
Postage 345 312 281 11 11
Telecommunications 321 279 278 15 —
Stationery and supplies 220 223 205 (1) 9
Security 176 179 167 (2) 7
Core deposit intangibles 113 112 123 1(9)
All other 1,313 1,030 973 27 6
Total $22,824 $20,837 $19,018 10 10