Wells Fargo 2007 Annual Report Download - page 68
Download and view the complete annual report
Please find page 68 of the 2007 Wells Fargo annual report below. You can navigate through the pages in the report by either clicking on the pages listed below, or by using the keyword search tool below to find specific information within the annual report.-
 1
1 -
2
-
3
-
4
-
5
-
6
-
7
-
8
-
9
-
10
-
11
-
12
-
13
-
14
-
15
-
16
-
17
-
18
-
19
-
20
-
21
-
22
-
23
-
24
-
25
-
26
-
27
-
28
-
29
-
30
-
31
-
32
-
33
-
34
-
35
-
36
-
37
-
38
-
39
-
40
-
41
-
42
-
43
-
44
-
45
-
46
-
47
-
48
-
49
-
50
-
51
-
52
-
53
-
54
-
55
-
56
-
57
-
 58
58 -
 59
59 -
 60
60 -
 61
61 -
 62
62 -
 63
63 -
 64
64 -
 65
65 -
 66
66 -
 67
67 -
 68
68 -
 69
69 -
 70
70 -
 71
71 -
 72
72 -
 73
73 -
 74
74 -
 75
75 -
 76
76 -
 77
77 -
 78
78 -
79
-
80
-
81
-
82
-
83
-
84
-
85
-
86
-
87
-
88
-
89
-
90
-
91
-
92
-
93
-
94
-
95
-
96
-
97
-
98
-
99
-
100
-
101
-
102
-
103
-
104
-
105
-
106
-
107
-
108
-
109
-
110
-
111
-
112
-
113
-
114
-
115
-
116
-
117
-
118
-
119
-
120
-
121
-
122
-
123
-
124
-
125
-
126
-
127
-
128
-
129
-
130
-
131
-
132
-
133
-
134
-
135
-
136
 |
 |

65
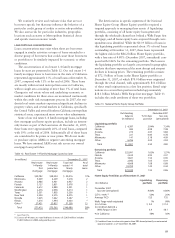
Comparison of 2006 with 2005
Net income in 2006 increased 10% to a record $8.4 billion
in 2006 from $7.7 billion in 2005. Diluted earnings per
common share increased 10% to a record $2.47 in 2006
from $2.25 in 2005.
Our 10% growth in earnings per share was driven by rev-
enue growth. Revenue grew 8% to a record $35.7 billion in
2006 from $32.9 billion in 2005. The breadth and depth of
our business model resulted in very strong and balanced
growth across product sources (net interest income up 8%,
noninterest income up 9%) and across businesses (double-
digit revenue and/or profit growth in regional banking, busi-
ness direct, wealth management, credit and debit card, cor-
porate trust, commercial banking, asset-based lending, asset
management, real estate brokerage, insurance, international,
commercial real estate, corporate banking and specialized
financial services).
We continued to make investments in 2006 by opening
109 regional banking stores and growing our sales and service
force by adding 4,497 team members (full-time equivalents)
in 2006, including 1,914 retail platform bankers. In 2006, we
continued to be #1 in many categories of financial services
nationally, including retail mortgage originations, home equity
lending, small business lending, agricultural lending, internet
banking, and provider of financial services to middle-market
companies in the western U.S.
Our core products grew in 2006 from 2005:
• Average loans grew by 4% (up 14% excluding real estate
1-4 family first mortgages);
• Average core deposits grew by 10%; and
• Assets managed and administered were up 26%.
Return on average total assets was 1.73% and return on
average stockholders’ equity was 19.52% in 2006, compared
with 1.72% and 19.59%, respectively, in 2005.
Net interest income on a taxable-equivalent basis was
$20.1 billion in 2006, compared with $18.6 billion a year
ago, reflecting solid loan growth (excluding ARMs) and a
relatively stable net interest margin. With short-term interest
Capital Management
We have an active program for managing stockholder capital.
We use capital to fund organic growth, acquire banks and
other financial services companies, pay dividends and repur-
chase our shares. Our objective is to produce above-market
long-term returns by opportunistically using capital when
returns are perceived to be high and issuing/accumulating
capital when the costs of doing so are perceived to be low.
From time to time the Board of Directors authorizes
the Company to repurchase shares of our common stock.
Although we announce when the Board authorizes share
repurchases, we typically do not give any public notice
before we repurchase our shares. Various factors determine
the amount and timing of our share repurchases, including
our capital requirements, the number of shares we expect to
issue for acquisitions and employee benefit plans, market
conditions (including the trading price of our stock), and
legal considerations. These factors can change at any time,
and there can be no assurance as to the number of shares we
will repurchase or when we will repurchase them.
Historically, our policy has been to repurchase shares
under the “safe harbor” conditions of Rule 10b-18 of the
Securities Exchange Act of 1934 including a limitation on
the daily volume of repurchases. Rule 10b-18 imposes an
additional daily volume limitation on share repurchases
during a pending merger or acquisition in which shares of
our stock will constitute some or all of the consideration.
Our management may determine that during a pending stock
merger or acquisition when the safe harbor would otherwise
be available, it is in our best interest to repurchase shares
in excess of this additional daily volume limitation. In such
cases, we intend to repurchase shares in compliance with the
other conditions of the safe harbor, including the standing
daily volume limitation that applies whether or not there is
a pending stock merger or acquisition.
In March, August and November 2007, the Board autho-
rized the repurchase of up to 75 million, 50 million and
75 million additional shares of our outstanding common
stock, respectively. During 2007, we repurchased 220 million
shares of our common stock. In 2007, we issued approximately
82 million shares of common stock (including shares issued
for our ESOP plan) under various employee benefit and director
plans and under our dividend reinvestment and direct stock
purchase programs and approximately 58 million shares for
acquisitions. At December 31, 2007, the total remaining
common stock repurchase authority was 42 million shares.
Our potential sources of capital include retained earnings
and issuances of common and preferred stock. In 2007, retained
earnings increased $3.8 billion, predominantly as a result of
net income of $8.1 billion less dividends of $4.0 billion. In
2007, we issued $2.3 billion of common stock under various
employee benefit and director plans and $2.1 billion of
common stock for acquisitions.
The Company and each of our subsidiary banks are sub-
ject to various regulatory capital adequacy requirements
administered by the Federal Reserve Board and the OCC.
Risk-based capital guidelines establish a risk-adjusted ratio
relating capital to different categories of assets and off-balance
sheet exposures. At December 31, 2007, the Company and
each of our covered subsidiary banks were “well capitalized”
under applicable regulatory capital adequacy guidelines. See
Note 26 (Regulatory and Agency Capital Requirements) to
Financial Statements for additional information.