Wells Fargo 2007 Annual Report Download - page 47
Download and view the complete annual report
Please find page 47 of the 2007 Wells Fargo annual report below. You can navigate through the pages in the report by either clicking on the pages listed below, or by using the keyword search tool below to find specific information within the annual report.-
 1
1 -
2
-
3
-
4
-
5
-
6
-
7
-
8
-
9
-
10
-
11
-
12
-
13
-
14
-
15
-
16
-
17
-
18
-
19
-
20
-
21
-
22
-
23
-
24
-
25
-
26
-
27
-
28
-
29
-
30
-
31
-
32
-
33
-
34
-
35
-
36
-
 37
37 -
 38
38 -
 39
39 -
 40
40 -
 41
41 -
 42
42 -
 43
43 -
 44
44 -
 45
45 -
 46
46 -
 47
47 -
 48
48 -
 49
49 -
 50
50 -
 51
51 -
 52
52 -
 53
53 -
 54
54 -
 55
55 -
 56
56 -
 57
57 -
58
-
59
-
60
-
61
-
62
-
63
-
64
-
65
-
66
-
67
-
68
-
69
-
70
-
71
-
72
-
73
-
74
-
75
-
76
-
77
-
78
-
79
-
80
-
81
-
82
-
83
-
84
-
85
-
86
-
87
-
88
-
89
-
90
-
91
-
92
-
93
-
94
-
95
-
96
-
97
-
98
-
99
-
100
-
101
-
102
-
103
-
104
-
105
-
106
-
107
-
108
-
109
-
110
-
111
-
112
-
113
-
114
-
115
-
116
-
117
-
118
-
119
-
120
-
121
-
122
-
123
-
124
-
125
-
126
-
127
-
128
-
129
-
130
-
131
-
132
-
133
-
134
-
135
-
136
 |
 |

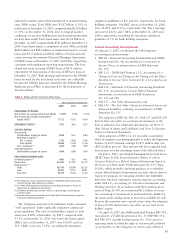
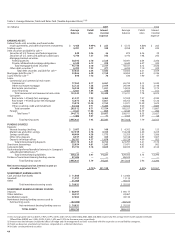
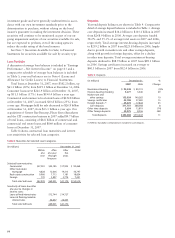
Table 3: Average Balances, Yields and Rates Paid (Taxable-Equivalent Basis) (1)(2)
(in millions) 2007 2006
Average Yields/ Interest Average Yields/ Interest
balance rates income/ balance rates income/
expense expense
EARNING ASSETS
Federal funds sold, securities purchased under
resale agreements and other short-term investments $ 4,468 4.99% $ 223 $ 5,515 4.80% $ 265
Trading assets 4,291 4.37 188 4,958 4.95 245
Debt securities available for sale
(3)
:
Securities of U.S. Treasury and federal agencies 848 4.26 36 875 4.36 39
Securities of U.S. states and political subdivisions 4,740 7.37 342 3,192 7.98 245
Mortgage-backed securities:
Federal agencies 38,592 6.10 2,328 36,691 6.04 2,206
Private collateralized mortgage obligations 6,548 6.12 399 6,640 6.57 430
Total mortgage-backed securities 45,140 6.10 2,727 43,331 6.12 2,636
Other debt securities (4) 6,295 7.52 477 6,204 7.10 439
Total debt securities available for sale
(4)
57,023 6.34 3,582 53,602 6.31 3,359
Mortgages held for sale (5) 33,066 6.50 2,150 42,855 6.41 2,746
Loans held for sale (5) 896 7.76 70 630 7.40 47
Loans:
Commercial and commercial real estate:
Commercial 77,965 8.17 6,367 65,720 8.13 5,340
Other real estate mortgage 32,722 7.38 2,414 29,344 7.32 2,148
Real estate construction 16,934 7.80 1,321 14,810 7.94 1,175
Lease financing 5,921 5.84 346 5,437 5.72 311
Total commercial and commercial real estate 133,542 7.82 10,448 115,311 7.78 8,974
Consumer:
Real estate 1-4 family first mortgage 61,527 7.25 4,463 57,509 7.27 4,182
Real estate 1-4 family junior lien mortgage 72,075 8.12 5,851 64,255 7.98 5,126
Credit card 15,874 13.58 2,155 12,571 13.29 1,670
Other revolving credit and installment 54,436 9.71 5,285 50,922 9.60 4,889
Total consumer 203,912 8.71 17,754 185,257 8.57 15,867
Foreign 7,321 11.68 855 6,343 12.39 786
Total loans (5) 344,775 8.43 29,057 306,911 8.35 25,627
Other 1,402 5.07 71 1,357 4.97 68
Total earning assets $445,921 7.93 35,341 $415,828 7.79 32,357
FUNDING SOURCES
Deposits:
Interest-bearing checking $ 5,057 3.16 160 $ 4,302 2.86 123
Market rate and other savings 147,939 2.78 4,105 134,248 2.40 3,225
Savings certificates 40,484 4.38 1,773 32,355 3.91 1,266
Other time deposits 8,937 4.87 435 32,168 4.99 1,607
Deposits in foreign offices 36,761 4.57 1,679 20,724 4.60 953
Total interest-bearing deposits 239,178 3.41 8,152 223,797 3.21 7,174
Short-term borrowings 25,854 4.81 1,245 21,471 4.62 992
Long-term debt 93,193 5.18 4,824 84,035 4.91 4,124
Guaranteed preferred beneficial interests in Company’s
subordinated debentures (6) — — — — — —
Total interest-bearing liabilities 358,225 3.97 14,221 329,303 3.73 12,290
Portion of noninterest-bearing funding sources 87,696 — — 86,525 — —
Total funding sources $445,921 3.19 14,221 $415,828 2.96 12,290
Net interest margin and net interest income on
a taxable-equivalent basis (7) 4.74% $21,120 4.83% $20,067
NONINTEREST-EARNING ASSETS
Cash and due from banks $ 11,806 $ 12,466
Goodwill 11,957 11,114
Other 51,068 46,615
Total noninterest-earning assets $ 74,831 $ 70,195
NONINTEREST-BEARING FUNDING SOURCES
Deposits $ 88,907 $ 89,117
Other liabilities 26,557 24,467
Stockholders’ equity 47,063 43,136
Noninterest-bearing funding sources used to
fund earning assets (87,696) (86,525)
Net noninterest-bearing funding sources $ 74,831 $ 70,195
TOTAL ASSETS $520,752 $486,023
44
(1) Our average prime rate was 8.05%, 7.96%, 6.19%, 4.34% and 4.12% for 2007, 2006, 2005, 2004 and 2003, respectively. The average three-month London Interbank
Offered Rate (LIBOR) was 5.30%, 5.20%, 3.56%, 1.62% and 1.22% for the same years, respectively.
(2) Interest rates and amounts include the effects of hedge and risk management activities associated with the respective asset and liability categories.
(3) Yields are based on amortized cost balances computed on a settlement date basis.
(4) Includes certain preferred securities.