Wells Fargo 2007 Annual Report Download - page 49
Download and view the complete annual report
Please find page 49 of the 2007 Wells Fargo annual report below. You can navigate through the pages in the report by either clicking on the pages listed below, or by using the keyword search tool below to find specific information within the annual report.-
 1
1 -
2
-
3
-
4
-
5
-
6
-
7
-
8
-
9
-
10
-
11
-
12
-
13
-
14
-
15
-
16
-
17
-
18
-
19
-
20
-
21
-
22
-
23
-
24
-
25
-
26
-
27
-
28
-
29
-
30
-
31
-
32
-
33
-
34
-
35
-
36
-
37
-
38
-
 39
39 -
 40
40 -
 41
41 -
 42
42 -
 43
43 -
 44
44 -
 45
45 -
 46
46 -
 47
47 -
 48
48 -
 49
49 -
 50
50 -
 51
51 -
 52
52 -
 53
53 -
 54
54 -
 55
55 -
 56
56 -
 57
57 -
 58
58 -
 59
59 -
60
-
61
-
62
-
63
-
64
-
65
-
66
-
67
-
68
-
69
-
70
-
71
-
72
-
73
-
74
-
75
-
76
-
77
-
78
-
79
-
80
-
81
-
82
-
83
-
84
-
85
-
86
-
87
-
88
-
89
-
90
-
91
-
92
-
93
-
94
-
95
-
96
-
97
-
98
-
99
-
100
-
101
-
102
-
103
-
104
-
105
-
106
-
107
-
108
-
109
-
110
-
111
-
112
-
113
-
114
-
115
-
116
-
117
-
118
-
119
-
120
-
121
-
122
-
123
-
124
-
125
-
126
-
127
-
128
-
129
-
130
-
131
-
132
-
133
-
134
-
135
-
136
 |
 |

46
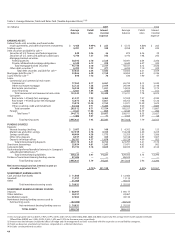
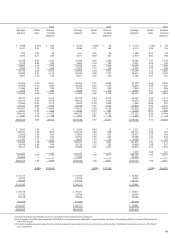
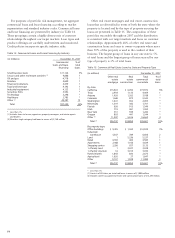
Table 4: Analysis of Changes in Net Interest Income
(in millions) Year ended December 31,
2007 over 2006 2006 over 2005
Volume Rate Total Volume Rate Total
Increase (decrease) in interest income:
Federal funds sold, securities purchased under resale
agreements and other short-term investments $ (52) $ 10 $ (42) $ 2 $ 99 $ 101
Trading assets (30) (27) (57) (17) 72 55
Debt securities available for sale:
Securities of U.S. Treasury and federal agencies (2) (1) (3) (5) 6 1
Securities of U.S. states and political subdivisions 117 (20) 97 (13) (8) (21)
Mortgage-backed securities:
Federal agencies 102 20 122 1,040 4 1,044
Private collateralized mortgage obligations (5) (26) (31) 93 54 147
Other debt securities 83038 173 — 173
Mortgages held for sale (634) 38 (596) 230 303 533
Loans held for sale 21 2 23 (146) 47 (99)
Loans:
Commercial and commercial real estate:
Commercial 1,001 26 1,027 529 860 1,389
Other real estate mortgage 248 18 266 16 296 312
Real estate construction 167 (21) 146 278 157 435
Lease financing 28 7 35 12 (10) 2
Consumer:
Real estate 1-4 family first mortgage 292 (11) 281 (1,441) 607 (834)
Real estate 1-4 family junior lien mortgage 634 91 725 620 827 1,447
Credit card 448 37 485 247 108 355
Other revolving credit and installment 339 57 396 730 365 1,095
Foreign 116 (47) 69 205 (55) 150
Other 2 1 3 (10) 10 —
Total increase in interest income 2,800 184 2,984 2,543 3,742 6,285
Increase (decrease) in interest expense:
Deposits:
Interest-bearing checking 23 14 37 12 60 72
Market rate and other savings 345 535 880 75 1,276 1,351
Savings certificates 343 164 507 337 273 610
Other time deposits (1,134) (38) (1,172) 167 530 697
Deposits in foreign offices 732 (6) 726 376 220 596
Short-term borrowings 211 42 253 (88) 336 248
Long-term debt 465 235 700 186 1,072 1,258
Total increase in interest expense 985 946 1,931 1,065 3,767 4,832
Increase (decrease) in net interest income
on a taxable-equivalent basis $ 1,815 $(762) $ 1,053 $ 1,478 $ (25) $1,453
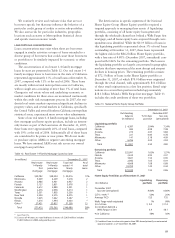
Table 4 allocates the changes in net interest income on
a taxable-equivalent basis to changes in either average
balances or average rates for both interest-earning assets
and interest-bearing liabilities. Because of the numerous
simultaneous volume and rate changes during any period,
it is not possible to precisely allocate such changes between
volume and rate. For this table, changes that are not solely
due to either volume or rate are allocated to these categories
in proportion to the percentage changes in average volume
and average rate.
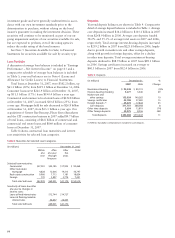
Noninterest Income
We earn trust, investment and IRA fees from managing and
administering assets, including mutual funds, corporate trust,
personal trust, employee benefit trust and agency assets. At
December 31, 2007, these assets totaled $1.12 trillion, up 14%
from $983 billion at December 31, 2006. Trust, investment
and IRA fees are primarily based on a tiered scale relative to
the market value of the assets under management or admin-
istration. The 13% increase in these fees in 2007 from 2006
was due to continued strong asset growth across all the trust
and investment management businesses.
We also receive commissions and other fees for providing
services to full-service and discount brokerage customers.
At December 31, 2007 and 2006, brokerage assets totaled
$131 billion and $115 billion, respectively. Generally, these
fees include transactional commissions, which are based
on the number of transactions executed at the customer’s
direction, or asset-based fees, which are based on the market
value of the customer’s assets. A significant portion of the
20% increase in these fees in 2007 from a year ago was due
to higher securities issuance and investment banking activity.
Card fees increased 22% to $2,136 million in 2007 from
$1,747 million in 2006, primarily due to an increase in the
percentage of our customer base using a Wells Fargo credit
card and to higher credit and debit card transaction volume.
Purchase volume on these cards increased 19% from a year
ago and average card balances were up 28%.