Wells Fargo 2007 Annual Report Download - page 125
Download and view the complete annual report
Please find page 125 of the 2007 Wells Fargo annual report below. You can navigate through the pages in the report by either clicking on the pages listed below, or by using the keyword search tool below to find specific information within the annual report.-
 1
1 -
2
-
3
-
4
-
5
-
6
-
7
-
8
-
9
-
10
-
11
-
12
-
13
-
14
-
15
-
16
-
17
-
18
-
19
-
20
-
21
-
22
-
23
-
24
-
25
-
26
-
27
-
28
-
29
-
30
-
31
-
32
-
33
-
34
-
35
-
36
-
37
-
38
-
39
-
40
-
41
-
42
-
43
-
44
-
45
-
46
-
47
-
48
-
49
-
50
-
51
-
52
-
53
-
54
-
55
-
56
-
57
-
58
-
59
-
60
-
61
-
62
-
63
-
64
-
65
-
66
-
67
-
68
-
69
-
70
-
71
-
72
-
73
-
74
-
75
-
76
-
77
-
78
-
79
-
80
-
81
-
82
-
83
-
84
-
85
-
86
-
87
-
88
-
89
-
90
-
91
-
92
-
93
-
94
-
95
-
96
-
97
-
98
-
99
-
100
-
101
-
102
-
103
-
104
-
105
-
106
-
107
-
108
-
109
-
110
-
111
-
112
-
113
-
114
-
 115
115 -
 116
116 -
 117
117 -
 118
118 -
 119
119 -
 120
120 -
 121
121 -
 122
122 -
 123
123 -
 124
124 -
 125
125 -
 126
126 -
 127
127 -
 128
128 -
 129
129 -
 130
130 -
 131
131 -
 132
132 -
 133
133 -
 134
134 -
 135
135 -
136
 |
 |

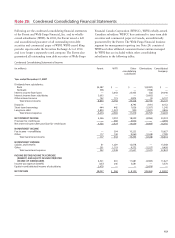
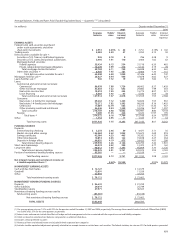
122
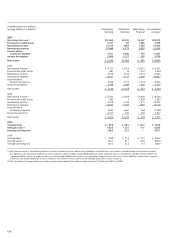
(income/expense in millions,
average balances in billions) Community Wholesale Wells Fargo Consolidated
Banking Banking Financial
Company
2007
Net interest income (1) $13,365 $3,382 $4,227 $20,974
Provision for credit losses 3,187 69 1,683 4,939
Noninterest income 12,173 4,959 1,284 18,416
Noninterest expense 15,000 4,772 3,052 22,824
Income before
income tax expense 7,351 3,500 776 11,627
Income tax expense 2,058 1,217 295 3,570
Net income $ 5,293 $2,283 $ 481 $ 8,057
2006
Net interest income (1) $ 13,117 $ 2,924 $ 3,910 $ 19,951
Provision for credit losses 887 16 1,301 2,204
Noninterest income 9,915 4,310 1,515 15,740
Noninterest expense 13,917 4,114 2,806 20,837
Income before
income tax expense 8,228 3,104 1,318 12,650
Income tax expense 2,678 1,086 466 4,230
Net income $ 5,550 $ 2,018 $ 852 $ 8,420
2005
Net interest income (1) $ 12,702 $ 2,393 $ 3,409 $ 18,504
Provision for credit losses 895 1 1,487 2,383
Noninterest income 9,418 3,756 1,271 14,445
Noninterest expense 12,972 3,487 2,559 19,018
Income before
income tax expense 8,253 2,661 634 11,548
Income tax expense 2,717 931 229 3,877
Net income $ 5,536 $ 1,730 $ 405 $ 7,671
2007
Average loans $ 194.0 $ 85.6 $ 65.2 $ 344.8
Average assets (2) 330.8 113.1 71.1 520.8
Average core deposits 249.8 53.3 — 303.1
2006
Average loans $ 178.0 $ 71.4 $ 57.5 $ 306.9
Average assets (2) 320.2 97.1 62.9 486.0
Average core deposits 233.5 35.3 0.1 268.9
(1) Net interest income is the difference between interest earned on assets and the cost of liabilities to fund those assets. Interest earned includes actual interest earned
on segment assets and, if the segment has excess liabilities, interest credits for providing funding to other segments. The cost of liabilities includes interest expense on
segment liabilities and, if the segment does not have enough liabilities to fund its assets, a funding charge based on the cost of excess liabilities from another segment.
In general, Community Banking has excess liabilities and receives interest credits for the funding it provides to other segments.
(2) The Consolidated Company balance includes unallocated goodwill held at the enterprise level of $5.8 billion for 2007 and 2006.