Wells Fargo 2007 Annual Report Download - page 6
Download and view the complete annual report
Please find page 6 of the 2007 Wells Fargo annual report below. You can navigate through the pages in the report by either clicking on the pages listed below, or by using the keyword search tool below to find specific information within the annual report.-
 1
1 -
 2
2 -
 3
3 -
 4
4 -
 5
5 -
 6
6 -
 7
7 -
 8
8 -
 9
9 -
 10
10 -
 11
11 -
 12
12 -
 13
13 -
 14
14 -
 15
15 -
 16
16 -
 17
17 -
18
-
19
-
20
-
21
-
22
-
23
-
24
-
25
-
26
-
27
-
28
-
29
-
30
-
31
-
32
-
33
-
34
-
35
-
36
-
37
-
38
-
39
-
40
-
41
-
42
-
43
-
44
-
45
-
46
-
47
-
48
-
49
-
50
-
51
-
52
-
53
-
54
-
55
-
56
-
57
-
58
-
59
-
60
-
61
-
62
-
63
-
64
-
65
-
66
-
67
-
68
-
69
-
70
-
71
-
72
-
73
-
74
-
75
-
76
-
77
-
78
-
79
-
80
-
81
-
82
-
83
-
84
-
85
-
86
-
87
-
88
-
89
-
90
-
91
-
92
-
93
-
94
-
95
-
96
-
97
-
98
-
99
-
100
-
101
-
102
-
103
-
104
-
105
-
106
-
107
-
108
-
109
-
110
-
111
-
112
-
113
-
114
-
115
-
116
-
117
-
118
-
119
-
120
-
121
-
122
-
123
-
124
-
125
-
126
-
127
-
128
-
129
-
130
-
131
-
132
-
133
-
134
-
135
-
136
 |
 |

4
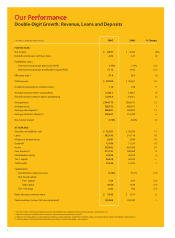
Our Performance
Double-Digit Growth: Revenue, Loans and Deposits
$ in millions, except per share amounts 2007 2006 1% Change
FOR THE YEAR
Net income $ 8,057 $ 8,420 (4)%
Diluted earnings per common share 2.38 2.47 (4)
Profitability ratios:
Net income to average total assets (ROA) 1.55% 1.73% (10)
Net income to average stockholders’ equity (ROE) 17.12 19.52 (12)
Efficiency ratio 257.9 58.4 (1)
Total revenue $ 39,390 $ 35,691 10
Dividends declared per common share 1.18 1.08 9
Average common shares outstanding 3,348.5 3,368.3 (1)
Diluted average common shares outstanding 3,382.8 3,410.1 (1)
Average loans $344,775 $306,911 12
Average assets 520,752 486,023 7
Average core deposits 3303,091 268,853 13
Average retail core deposits 4228,667 215,788 6
Net interest margin 4.74% 4.83% (2)
AT YEAR END
Securities available for sale $ 72,951 $ 42,629 71
Loans 382,195 319,116 20
Allowance for loan losses 5,307 3,764 41
Goodwill 13,106 11,275 16
Assets 575,442 481,996 19
Core deposits 3311,731 288,068 8
Stockholders’ equity 47,628 45,814 4
Tier 1 capital 36,674 36,746 —
Total capital 51,638 51,365 1
Capital ratios:
Stockholders’ equity to assets 8.28% 9.51% (13)
Risk-based capital
Tier 1 capital 7.59 8.93 (15)
Total capital 10.68 12.49 (14)
Tier 1 leverage 6.83 7.88 (13)
Book value per common share $ 14.45 $ 13.57 6
Team members (active, full-time equivalent) 159,800 158,000 1
1 Revised to reflect $95 million of litigation expenses for indemnification obligations relating to the Company’s ownership in Visa.
2 Noninterest expense divided by total revenue (net interest income and noninterest income).
3 Noninterest-bearing deposits, interest-bearing checking, savings certificates, market rate and other savings, and certain foreign deposits (Eurodollar sweep balances).
4 Total core deposits excluding Wholesale Banking core deposits and retail mortgage escrow deposits.