Wells Fargo 2007 Annual Report Download - page 90
Download and view the complete annual report
Please find page 90 of the 2007 Wells Fargo annual report below. You can navigate through the pages in the report by either clicking on the pages listed below, or by using the keyword search tool below to find specific information within the annual report.-
 1
1 -
2
-
3
-
4
-
5
-
6
-
7
-
8
-
9
-
10
-
11
-
12
-
13
-
14
-
15
-
16
-
17
-
18
-
19
-
20
-
21
-
22
-
23
-
24
-
25
-
26
-
27
-
28
-
29
-
30
-
31
-
32
-
33
-
34
-
35
-
36
-
37
-
38
-
39
-
40
-
41
-
42
-
43
-
44
-
45
-
46
-
47
-
48
-
49
-
50
-
51
-
52
-
53
-
54
-
55
-
56
-
57
-
58
-
59
-
60
-
61
-
62
-
63
-
64
-
65
-
66
-
67
-
68
-
69
-
70
-
71
-
72
-
73
-
74
-
75
-
76
-
77
-
78
-
79
-
 80
80 -
 81
81 -
 82
82 -
 83
83 -
 84
84 -
 85
85 -
 86
86 -
 87
87 -
 88
88 -
 89
89 -
 90
90 -
 91
91 -
 92
92 -
 93
93 -
 94
94 -
 95
95 -
 96
96 -
 97
97 -
 98
98 -
 99
99 -
 100
100 -
101
-
102
-
103
-
104
-
105
-
106
-
107
-
108
-
109
-
110
-
111
-
112
-
113
-
114
-
115
-
116
-
117
-
118
-
119
-
120
-
121
-
122
-
123
-
124
-
125
-
126
-
127
-
128
-
129
-
130
-
131
-
132
-
133
-
134
-
135
-
136
 |
 |

87
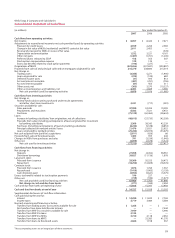
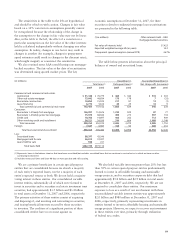
(in millions) December 31, 2007
Total Weighted- Remaining contractual principal maturity
amount average After one year After five years
yield Within one year through five years through ten years After ten years
Amount Yield Amount Yield Amount Yield Amount Yield
Securities of U.S. Treasury
and federal agencies $ 982 4.25% $ 87 3.78% $ 666 4.14% $ 227 4.73% $ 2 7.25%
Securities of U.S. states and
political subdivisions 6,152 7.14 301 6.52 881 6.86 1,386 6.93 3,584 7.34
Mortgage-backed securities:
Federal agencies 34,987 5.92 1 6.27 128 8.25 160 7.00 34,698 5.91
Private collateralized
mortgage obligations 19,982 6.04 —— — — 318 6.01 19,664 6.04
Total mortgage-backed securities 54,969 5.96 1 6.27 128 8.25 478 6.34 54,362 5.95
Other 8,065 6.65 860 6.25 4,982 6.32 1,021 7.31 1,202 7.71
Total debt securities at fair value (1) $70,168 6.12% $1,249 6.14% $6,657 6.21% $3,112 6.81% $59,150 6.07%
(1) The weighted-average yield is computed using the contractual life amortization method.
The decline in fair value for the debt securities that had
been in a continuous loss position for 12 months or more at
December 31, 2007, was due to changes in market interest
rates and not due to the credit quality of the securities. We
believe that the principal and interest on these securities are
fully collectible and we have the intent and ability to retain
our investment for a period of time to allow for any anticipated
recovery in market value. We have reviewed these securities
in accordance with our policy and do not consider them to
be other-than-temporarily impaired.
Securities pledged where the secured party has the right
to sell or repledge totaled $5.8 billion at December 31, 2007
and $5.3 billion at December 31, 2006. Securities pledged
where the secured party does not have the right to sell or
repledge totaled $44.9 billion at December 31, 2007, and
$29.3 billion at December 31, 2006, primarily to secure
trust and public deposits and for other purposes as required
or permitted by law.
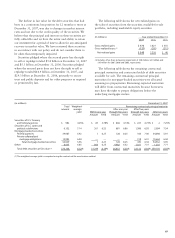
The following table shows the remaining contractual
principal maturities and contractual yields of debt securities
available for sale. The remaining contractual principal
maturities for mortgage-backed securities were allocated
assuming no prepayments. Remaining expected maturities
will differ from contractual maturities because borrowers
may have the right to prepay obligations before the
underlying mortgages mature.
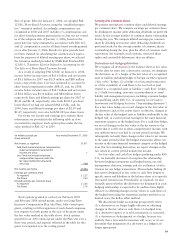
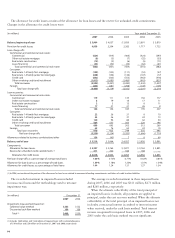
The following table shows the net realized gains on
the sales of securities from the securities available-for-sale
portfolio, including marketable equity securities.
(in millions) Year ended December 31,
2007 2006 2005
Gross realized gains $ 472 $ 621 $ 355
Gross realized losses (1) (127) (295) (315)
Net realized gains $ 345 $ 326 $ 40
(1) Includes other-than-temporary impairment of $50 million, $22 million and
$45 million for 2007, 2006 and 2005, respectively.