Wells Fargo 2007 Annual Report Download - page 52
Download and view the complete annual report
Please find page 52 of the 2007 Wells Fargo annual report below. You can navigate through the pages in the report by either clicking on the pages listed below, or by using the keyword search tool below to find specific information within the annual report.-
 1
1 -
2
-
3
-
4
-
5
-
6
-
7
-
8
-
9
-
10
-
11
-
12
-
13
-
14
-
15
-
16
-
17
-
18
-
19
-
20
-
21
-
22
-
23
-
24
-
25
-
26
-
27
-
28
-
29
-
30
-
31
-
32
-
33
-
34
-
35
-
36
-
37
-
38
-
39
-
40
-
41
-
 42
42 -
 43
43 -
 44
44 -
 45
45 -
 46
46 -
 47
47 -
 48
48 -
 49
49 -
 50
50 -
 51
51 -
 52
52 -
 53
53 -
 54
54 -
 55
55 -
 56
56 -
 57
57 -
 58
58 -
 59
59 -
 60
60 -
 61
61 -
 62
62 -
63
-
64
-
65
-
66
-
67
-
68
-
69
-
70
-
71
-
72
-
73
-
74
-
75
-
76
-
77
-
78
-
79
-
80
-
81
-
82
-
83
-
84
-
85
-
86
-
87
-
88
-
89
-
90
-
91
-
92
-
93
-
94
-
95
-
96
-
97
-
98
-
99
-
100
-
101
-
102
-
103
-
104
-
105
-
106
-
107
-
108
-
109
-
110
-
111
-
112
-
113
-
114
-
115
-
116
-
117
-
118
-
119
-
120
-
121
-
122
-
123
-
124
-
125
-
126
-
127
-
128
-
129
-
130
-
131
-
132
-
133
-
134
-
135
-
136
 |
 |

49
Noninterest income increased 23% to $12.17 billion in 2007
from $9.92 billion in 2006, primarily due to retail banking
fee revenue growth in brokerage, deposit service charges,
cards and investments. Noninterest income also included
higher mortgage banking revenue, which increased $505 million
(18%) largely due to higher servicing income. The provision
for credit losses for 2007 increased to $3.19 billion in 2007
from $887 million in 2006 including the fourth quarter 2007
$1.4 billion credit reserve build, with over half of the remaining
increase in the Home Equity portfolio. Noninterest expense
for 2007 increased 8% to $15.00 billion in 2007 from
$13.92 billion in 2006, due to growth in personnel expenses.
WHOLESALE BANKING’S net income increased 13% to a record
$2.28 billion in 2007 from $2.02 billion in 2006. Revenue
increased 15% to a record $8.34 billion from $7.23 billion
in 2006. Net interest income increased 16% to $3.38 billion
for 2007 from $2.92 billion for 2006 primarily due to higher
earning asset volumes and earning asset yields and related
fees, partially offset by higher funding costs. Average loans
increased 20% to $85.6 billion in 2007 from $71.4 billion
in 2006. Average core deposits grew 51% to $53.3 billion
primarily due to large corporate and middle-market relation-
ships, international and correspondent banking customers
and from higher Eurodollar sweep and liquidity balances from
our asset management customers. The increase in provision
for credit losses to $69 million in 2007 from $16 million in
2006 was due to higher net charge-offs. Noninterest income
increased 15% to $4.96 billion in 2007, due to higher deposit
service charges, trust and investment income, foreign exchange
fees, insurance revenue, commercial real estate brokerage fees
and capital markets activity. Noninterest expense increased
16% to $4.77 billion in 2007 from $4.11 billion in 2006,
due to higher personnel-related costs, expenses related to
higher sales volumes, investments in new offices and busi-
nesses and acquisitions.
WELLS FARGO FINANCIAL’S net income decreased 44% to
$481 million in 2007 from $852 million in 2006 reflecting
higher credit losses and our decision in late 2006 to slow the
growth in our auto portfolio as well as the divestiture of some
of our Latin American operations and a $50 million reversal
of Hurricane Katrina-related reserves, both in 2006. Revenue
was up 2% to $5.51 billion in 2007 from $5.43 billion in
2006. Net interest income increased 8% to $4.23 billion
from $3.91 billion in 2006 due to growth in average loans.
Average loans increased 13% to $65.2 billion in 2007 from
$57.5 billion in 2006. The provision for credit losses increased
$382 million in 2007 from 2006, primarily due to an increase
in net charge-offs in the auto lending and credit card portfo-
lios, and lower net charge-offs in early 2006 relating to
the bankruptcy law change in October 2005. Noninterest
income decreased $231 million in 2007 from 2006 in part,
as a result of the Latin American sale. Noninterest expense
increased $246 million (9%) in 2007 from 2006, primarily
due to higher employee compensation and benefit costs. A
significant portion of this increase was due to Wells Fargo
Financial’s continued focus on reducing losses and delin-
quencies in auto lending and credit card portfolios by
improving processes and staffing levels in collections.
Balance Sheet Analysis
Securities Available for Sale
Our securities available for sale consist of both debt and
marketable equity securities. We hold debt securities available
for sale primarily for liquidity, interest rate risk management
and long-term yield enhancement. Accordingly, this portfolio
primarily includes very liquid, high-quality federal agency and
privately issued mortgage-backed securities. At December 31,
2007, we held $70.2 billion of debt securities available for
sale, with net unrealized gains of $775 million, compared
with $41.8 billion at December 31, 2006, with net unrealized
gains of $722 million. We also held $2.8 billion of marketable
equity securities available for sale at December 31, 2007,
and $796 million at December 31, 2006, with net unrealized
losses of $95 million and net gains of $204 million for the
same periods, respectively. The increase in marketable equity
securities was primarily due to our adoption of Topic
D-109 effective July 1, 2007, which resulted in the transfer
of approximately $1.2 billion of securities, consisting of
investments in preferred stock callable by the issuer, from
trading assets to securities available for sale.
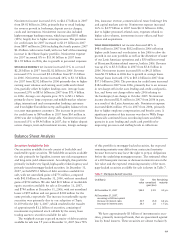
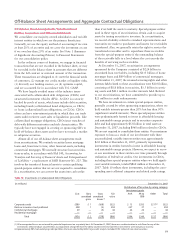
The weighted-average expected maturity of debt securities
available for sale was 5.9 years at December 31, 2007. Since 78%
of this portfolio is mortgage-backed securities, the expected
remaining maturity may differ from contractual maturity
because borrowers may have the right to prepay obligations
before the underlying mortgages mature. The estimated effect
of a 200 basis point increase or decrease in interest rates on the
fair value and the expected remaining maturity of the mort-
gage-backed securities available for sale is shown in Table 7.
Table 7: Mortgage-Backed Securities
(in billions) Fair Net Remaining
value unrealized maturity
gain (loss)
At December 31, 2007 $55.0 $ 0.9 4.0 yrs.
At December 31, 2007,
assuming a 200 basis point:
Increase in interest rates 50.7 (3.4) 6.4 yrs.
Decrease in interest rates 56.7 2.6 1.7 yrs.
We have approximately $3 billion of investments in secu-
rities, primarily municipal bonds, that are guaranteed against
loss by bond insurers. These securities are almost exclusively