Wells Fargo 2007 Annual Report Download - page 130
Download and view the complete annual report
Please find page 130 of the 2007 Wells Fargo annual report below. You can navigate through the pages in the report by either clicking on the pages listed below, or by using the keyword search tool below to find specific information within the annual report.-
 1
1 -
2
-
3
-
4
-
5
-
6
-
7
-
8
-
9
-
10
-
11
-
12
-
13
-
14
-
15
-
16
-
17
-
18
-
19
-
20
-
21
-
22
-
23
-
24
-
25
-
26
-
27
-
28
-
29
-
30
-
31
-
32
-
33
-
34
-
35
-
36
-
37
-
38
-
39
-
40
-
41
-
42
-
43
-
44
-
45
-
46
-
47
-
48
-
49
-
50
-
51
-
52
-
53
-
54
-
55
-
56
-
57
-
58
-
59
-
60
-
61
-
62
-
63
-
64
-
65
-
66
-
67
-
68
-
69
-
70
-
71
-
72
-
73
-
74
-
75
-
76
-
77
-
78
-
79
-
80
-
81
-
82
-
83
-
84
-
85
-
86
-
87
-
88
-
89
-
90
-
91
-
92
-
93
-
94
-
95
-
96
-
97
-
98
-
99
-
100
-
101
-
102
-
103
-
104
-
105
-
106
-
107
-
108
-
109
-
110
-
111
-
112
-
113
-
114
-
115
-
116
-
117
-
118
-
119
-
 120
120 -
 121
121 -
 122
122 -
 123
123 -
 124
124 -
 125
125 -
 126
126 -
 127
127 -
 128
128 -
 129
129 -
 130
130 -
 131
131 -
 132
132 -
 133
133 -
 134
134 -
 135
135 -
 136
136
 |
 |

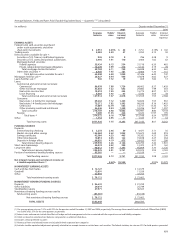
127
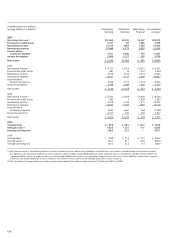
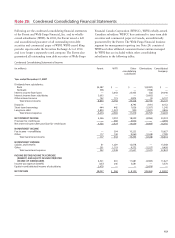
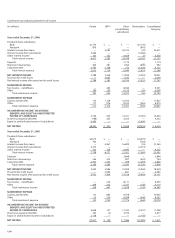
Condensed Consolidating Statement of Cash Flows
(in millions) Parent WFFI Other Consolidated
consolidating Company
subsidiaries/
eliminations
Year ended December 31, 2005
Cash flows from operating activities:
Net cash provided (used) by operating activities $ 5,396 $ 1,159 $(18,540)$(11,985)
Cash flows from investing activities:
Securities available for sale:
Sales proceeds 631 281 18,147 19,059
Prepayments and maturities 90 248 6,634 6,972
Purchases (231) (486) (27,917) (28,634)
Loans:
Increase in banking subsidiaries’ loan
originations, net of collections — (953) (41,356) (42,309)
Proceeds from sales (including participations) of loans
originated for investment by banking subsidiaries — 232 42,007 42,239
Purchases (including participations) of loans by
banking subsidiaries — — (8,853) (8,853)
Principal collected on nonbank entities’ loans — 19,542 3,280 22,822
Loans originated by nonbank entities — (29,757) (3,918) (33,675)
Net repayments from (advances to) subsidiaries (3,166) — 3,166 —
Capital notes and term loans made to subsidiaries (10,751) — 10,751 —
Principal collected on notes/loans made to subsidiaries 2,950 — (2,950) —
Net decrease (increase) in investment in subsidiaries 194 — (194) —
Net cash acquired from acquisitions — — 66 66
Other, net — (1,059) (4,045) (5,104)
Net cash used by investing activities (10,283) (11,952) (5,182) (27,417)
Cash flows from financing activities:
Net change in:
Deposits — — 38,961 38,961
Short-term borrowings 1,048 3,344 (2,514) 1,878
Long-term debt:
Proceeds from issuance 18,297 11,891 (3,715) 26,473
Repayment (8,216) (4,450) (5,910) (18,576)
Common stock:
Proceeds from issuance 1,367 — — 1,367
Repurchased (3,159) — — (3,159)
Cash dividends paid (3,375) — — (3,375)
Other, net — — (1,673) (1,673)
Net cash provided by financing activities 5,962 10,785 25,149 41,896
Net change in cash and due from banks 1,075 (8) 1,427 2,494
Cash and due from banks at beginning of year 9,719 482 2,702 12,903
Cash and due from banks at end of year $ 10,794 $ 474 $ 4,129 $ 15,397
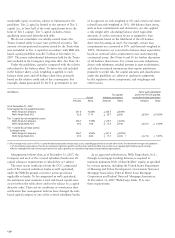
Note 26: Regulatory and Agency Capital Requirements
The Company and each of its subsidiary banks are subject to
various regulatory capital adequacy requirements administered
by the Federal Reserve Board (FRB) and the OCC, respectively.
The Federal Deposit Insurance Corporation Improvement
Act of 1991 (FDICIA) required that the federal regulatory
agencies adopt regulations defining five capital tiers for banks:
well capitalized, adequately capitalized, undercapitalized,
significantly undercapitalized and critically undercapitalized.
Failure to meet minimum capital requirements can initiate
certain mandatory, and possibly additional discretionary,
actions by regulators that, if undertaken, could have a
direct material effect on our financial statements.
Quantitative measures, established by the regulators to
ensure capital adequacy, require that the Company and each
of the subsidiary banks maintain minimum ratios (set forth
in the following table) of capital to risk-weighted assets.
There are three categories of capital under the guidelines.
Tier 1 capital includes common stockholders’ equity, qualifying
preferred stock and trust preferred securities, less goodwill
and certain other deductions (including a portion of servicing
assets and the unrealized net gains and losses, after taxes, on
securities available for sale). Tier 2 capital includes preferred
stock not qualifying as Tier 1 capital, subordinated debt,
the allowance for credit losses and net unrealized gains on