Wells Fargo 2007 Annual Report Download - page 58
Download and view the complete annual report
Please find page 58 of the 2007 Wells Fargo annual report below. You can navigate through the pages in the report by either clicking on the pages listed below, or by using the keyword search tool below to find specific information within the annual report.-
 1
1 -
2
-
3
-
4
-
5
-
6
-
7
-
8
-
9
-
10
-
11
-
12
-
13
-
14
-
15
-
16
-
17
-
18
-
19
-
20
-
21
-
22
-
23
-
24
-
25
-
26
-
27
-
28
-
29
-
30
-
31
-
32
-
33
-
34
-
35
-
36
-
37
-
38
-
39
-
40
-
41
-
42
-
43
-
44
-
45
-
46
-
47
-
 48
48 -
 49
49 -
 50
50 -
 51
51 -
 52
52 -
 53
53 -
 54
54 -
 55
55 -
 56
56 -
 57
57 -
 58
58 -
 59
59 -
 60
60 -
 61
61 -
 62
62 -
 63
63 -
 64
64 -
 65
65 -
 66
66 -
 67
67 -
 68
68 -
69
-
70
-
71
-
72
-
73
-
74
-
75
-
76
-
77
-
78
-
79
-
80
-
81
-
82
-
83
-
84
-
85
-
86
-
87
-
88
-
89
-
90
-
91
-
92
-
93
-
94
-
95
-
96
-
97
-
98
-
99
-
100
-
101
-
102
-
103
-
104
-
105
-
106
-
107
-
108
-
109
-
110
-
111
-
112
-
113
-
114
-
115
-
116
-
117
-
118
-
119
-
120
-
121
-
122
-
123
-
124
-
125
-
126
-
127
-
128
-
129
-
130
-
131
-
132
-
133
-
134
-
135
-
136
 |
 |

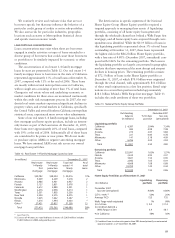
55
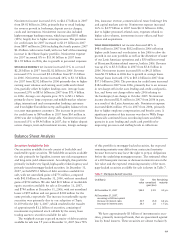
Table 12: Real Estate 1-4 Family Mortgage Loans by State
(in millions) December 31, 2007
Real estate Real estate Total real % of
1-4 family 1-4 family estate 1-4 total
first junior lien family loans
mortgage mortgage mortgage
California $20,782 $28,234 $ 49,016 13%
Minnesota 3,009 4,209 7,218 2
Arizona 2,986 3,451 6,437 2
Florida 3,127 2,851 5,978 2
Colorado 2,612 2,889 5,501 1
Washington 2,476 2,938 5,414 1
Texas 3,551 1,805 5,356 1
New York 2,200 2,275 4,475 1
Nevada 1,625 1,642 3,267 *
Illinois 1,616 1,444 3,060 *
Other (1) 27,431 23,827 51,258 13
Total $71,415 $75,565 $146,980 38%
* Less than 1%.
(1) Consists of 40 states; no state had loans in excess of $2,959 million. Includes
$5,029 million in GNMA early pool buyouts.
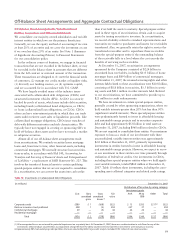
We routinely review and evaluate risks that are not
borrower specific but that may influence the behavior of a
particular credit, group of credits or entire sub-portfolios.
We also assess risk for particular industries, geographic
locations such as states or Metropolitan Statistical Areas
and specific macroeconomic trends.
LOAN PORTFOLIO CONCENTRATIONS
Loan concentrations may exist when there are borrowers
engaged in similar activities or types of loans extended to a
diverse group of borrowers that could cause those borrowers
or portfolios to be similarly impacted by economic or other
conditions.
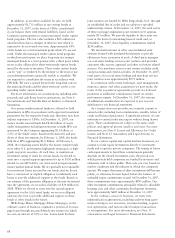
The concentrations of real estate 1-4 family mortgage
loans by state are presented in Table 12. Our real estate 1-4
family mortgage loans to borrowers in the state of California
represented approximately 13% of total loans at December 31,
2007, compared with 11% at the end of 2006. These loans
are mostly within several metropolitan areas in California,
with no single area consisting of more than 3% of total loans.
Changes in real estate values and underlying economic or
market conditions for these areas are monitored continuously
within the credit risk management process. In 2007, the resi-
dential real estate markets experienced significant declines in
property values, and several markets in California, specifically
the Central Valley and several Southern California metropolitan
statistical areas, experienced more severe value adjustments.
Some of our real estate 1-4 family mortgage loans, including
first mortgage and home equity products, include an interest-
only feature as part of the loan terms. At December 31, 2007,
these loans were approximately 20% of total loans, compared
with 19% at the end of 2006. Substantially all of these loans
are considered to be prime or near prime. We do not make
or purchase option ARMs or negative amortizing mortgage
loans. We have minimal ARM reset risk across our owned
mortgage loan portfolios.
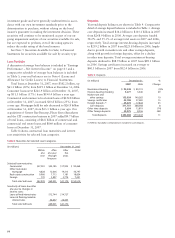
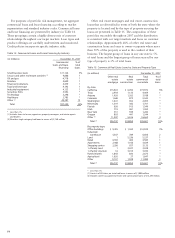
Table 13: National Home Equity Group Portfolio
December 31, 2007
Outstanding December 2007
balance % 30 days loss rate
(in millions) past due (annualized)
Liquidating portfolio
California $ 4,387 2.94% 7.34%
Florida 582 4.98 7.08
Arizona 274 2.67 5.84
Texas 221 0.83 0.78
Minnesota 141 3.18 4.09
Other 6,296 2.00 2.94
Total $11,901 2.50 4.80
Remaining portfolio
California $25,991 1.63% 1.27%
Florida 2,614 2.92 2.57
Arizona 3,821 1.54 0.90
Texas 2,842 1.03 0.19
Minnesota 4,668 1.08 0.88
Other 32,393 1.43 0.44
Total $72,329 1.52 0.86
Home Equity Portfolios as of December 31, 2007
Liquidating Remaining
($ in billions) portfolio portfolio
December 2007
loss rate (annualized) 4.80% 0.86%
CLTV > 90% (1) 55% 25%
Average FICO 725 735
Wells Fargo retail originated 1% 98%
$ in 1st lien $ 0.4 $11.4
$ in 2nd lien behind a
Wells Fargo 1st lien 3.4 38.1
% in California 38% 36%
(1) Combined loan-to-value ratio greater than 90% based primarily on automated
appraisal updates as of September 30, 2007.
The deterioration in specific segments of the National
Home Equity Group (Home Equity) portfolio required a
targeted approach to managing these assets. A liquidating
portfolio, consisting of all home equity loans generated
through the wholesale channel not behind a Wells Fargo first
mortgage, and all home equity loans acquired through corre-
spondents was identified. While the $11.9 billion of loans in
this liquidating portfolio represented about 3% of total loans
outstanding at December 31, 2007, these loans represented
the highest risk in the $84.2 billion Home Equity portfolio,
with a loss rate of 4.80% (December 2007, annualized) com-
pared with 0.86% for the remaining portfolio. The loans in
the liquidating portfolio are largely concentrated in geographic
markets that have experienced the most abrupt and steepest
declines in housing prices. The remaining portfolio consists
of $72.3 billion of loans in the Home Equity portfolio at
December 31, 2007, of which $70.9 billion were originated
through the retail channel, with approximately $11.4 billion
of these retail originations in a first lien position. Retail origi-
nations in a second lien position included approximately
$38.1 billion behind a Wells Fargo first mortgage. Table 13
includes the credit attributes of these two portfolios.