Wells Fargo 2007 Annual Report Download - page 134
Download and view the complete annual report
Please find page 134 of the 2007 Wells Fargo annual report below. You can navigate through the pages in the report by either clicking on the pages listed below, or by using the keyword search tool below to find specific information within the annual report.-
 1
1 -
2
-
3
-
4
-
5
-
6
-
7
-
8
-
9
-
10
-
11
-
12
-
13
-
14
-
15
-
16
-
17
-
18
-
19
-
20
-
21
-
22
-
23
-
24
-
25
-
26
-
27
-
28
-
29
-
30
-
31
-
32
-
33
-
34
-
35
-
36
-
37
-
38
-
39
-
40
-
41
-
42
-
43
-
44
-
45
-
46
-
47
-
48
-
49
-
50
-
51
-
52
-
53
-
54
-
55
-
56
-
57
-
58
-
59
-
60
-
61
-
62
-
63
-
64
-
65
-
66
-
67
-
68
-
69
-
70
-
71
-
72
-
73
-
74
-
75
-
76
-
77
-
78
-
79
-
80
-
81
-
82
-
83
-
84
-
85
-
86
-
87
-
88
-
89
-
90
-
91
-
92
-
93
-
94
-
95
-
96
-
97
-
98
-
99
-
100
-
101
-
102
-
103
-
104
-
105
-
106
-
107
-
108
-
109
-
110
-
111
-
112
-
113
-
114
-
115
-
116
-
117
-
118
-
119
-
120
-
121
-
122
-
123
-
 124
124 -
 125
125 -
 126
126 -
 127
127 -
 128
128 -
 129
129 -
 130
130 -
 131
131 -
 132
132 -
 133
133 -
 134
134 -
 135
135 -
 136
136
 |
 |

131
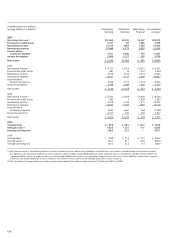
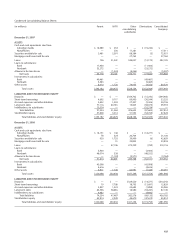
Average Balances, Yields and Rates Paid (Taxable-Equivalent Basis) — Quarterly (1)(2) (Unaudited)
(in millions) Quarter ended December 31,
2007 2006
Average Yields/ Interest Average Yields/ Interest
balance rates income/ balance rates income/
expense expense
EARNING ASSETS
Federal funds sold, securities purchased
under resale agreements and other
short-term investments $ 2,972 4.45% $ 34 $ 7,751 5.19% $ 102
Trading assets 4,248 3.39 37 3,950 5.12 50
Debt securities available for sale (3):
Securities of U.S. Treasury and federal agencies 926 4.18 9 786 4.28 9
Securities of U.S. states and political subdivisions 5,995 7.41 110 3,406 7.62 62
Mortgage-backed securities:
Federal agencies 35,434 6.15 534 31,718 6.20 483
Private collateralized mortgage obligations 14,270 5.99 214 5,130 6.19 78
Total mortgage-backed securities 49,704 6.11 748 36,848 6.20 561
Other debt securities (4) 8,465 7.45 161 6,406 7.20 115
Total debt securities available for sale (4) 65,090 6.38 1,028 47,446 6.40 747
Mortgages held for sale (5) 28,327 6.44 456 37,878 6.62 627
Loans held for sale (5) 965 7.72 19 659 7.60 13
Loans:
Commercial and commercial real estate:
Commercial 86,958 7.88 1,726 68,402 8.27 1,426
Other real estate mortgage 35,863 7.22 652 29,882 7.49 563
Real estate construction 18,510 7.35 343 15,775 8.07 321
Lease financing 6,583 5.92 97 5,500 5.66 78
Total commercial and commercial real estate 147,914 7.57 2,818 119,559 7.93 2,388
Consumer:
Real estate 1-4 family first mortgage 69,262 7.12 1,235 50,836 7.53 961
Real estate 1-4 family junior lien mortgage 75,272 7.92 1,503 68,208 8.16 1,403
Credit card 17,689 12.79 565 13,737 13.30 457
Other revolving credit and installment 56,546 9.54 1,359 53,206 9.67 1,297
Total consumer 218,769 8.48 4,662 185,987 8.80 4,118
Foreign 7,689 11.55 224 6,620 11.97 199
Total loans (5) 374,372 8.18 7,704 312,166 8.54 6,705
Other 1,552 4.95 17 1,333 5.17 18
Total earning assets $477,526 7.75 9,295 $411,183 8.01 8,262
FUNDING SOURCES
Deposits:
Interest-bearing checking $ 5,254 2.96 39 $ 4,477 3.11 35
Market rate and other savings 156,260 2.63 1,035 135,673 2.69 918
Savings certificates 42,560 4.33 465 36,382 4.33 398
Other time deposits 10,874 4.45 122 19,838 5.27 264
Deposits in foreign offices 44,991 4.19 475 24,425 4.65 286
Total interest-bearing deposits 259,939 3.26 2,136 220,795 3.42 1,901
Short-term borrowings 34,074 4.42 380 13,470 4.77 162
Long-term debt 98,012 5.06 1,245 85,809 5.20 1,120
Total interest-bearing liabilities 392,025 3.81 3,761 320,074 3.95 3,183
Portion of noninterest-bearing funding sources 85,501 — — 91,109 — —
Total funding sources $477,526 3.13 3,761 $411,183 3.08 3,183
Net interest margin and net interest income on
a taxable-equivalent basis (6) 4.62% $5,534 4.93% $5,079
NONINTEREST-EARNING ASSETS
Cash and due from banks $ 12,127 $ 12,379
Goodwill 13,091 11,259
Other 52,903 47,764
Total noninterest-earning assets $ 78,121 $ 71,402
NONINTEREST-BEARING FUNDING SOURCES
Deposits $ 86,632 $ 91,259
Other liabilities 29,019 25,749
Stockholders’ equity 47,971 45,503
Noninterest-bearing funding sources used to
fund earning assets (85,501) (91,109)
Net noninterest-bearing funding sources $ 78,121 $ 71,402
TOTAL ASSETS $555,647 $482,585
(1) Our average prime rate was 7.52% and 8.25% for the quarters ended December 31, 2007 and 2006, respectively. The average three-month London Interbank Offered Rate (LIBOR)
was 5.03% and 5.37% for the same quarters, respectively.
(2) Interest rates and amounts include the effects of hedge and risk management activities associated with the respective asset and liability categories.
(3) Yields are based on amortized cost balances computed on a settlement date basis.
(4) Includes certain preferred securities.
(5) Nonaccrual loans and related income are included in their respective loan categories.
(6) Includes taxable-equivalent adjustments primarily related to tax-exempt income on certain loans and securities. The federal statutory tax rate was 35% for both quarters presented.