Wells Fargo 2007 Annual Report Download - page 9
Download and view the complete annual report
Please find page 9 of the 2007 Wells Fargo annual report below. You can navigate through the pages in the report by either clicking on the pages listed below, or by using the keyword search tool below to find specific information within the annual report.-
 1
1 -
 2
2 -
 3
3 -
 4
4 -
 5
5 -
 6
6 -
 7
7 -
 8
8 -
 9
9 -
 10
10 -
 11
11 -
 12
12 -
 13
13 -
 14
14 -
 15
15 -
 16
16 -
 17
17 -
 18
18 -
 19
19 -
 20
20 -
21
-
22
-
23
-
24
-
25
-
26
-
27
-
28
-
29
-
30
-
31
-
32
-
33
-
34
-
35
-
36
-
37
-
38
-
39
-
40
-
41
-
42
-
43
-
44
-
45
-
46
-
47
-
48
-
49
-
50
-
51
-
52
-
53
-
54
-
55
-
56
-
57
-
58
-
59
-
60
-
61
-
62
-
63
-
64
-
65
-
66
-
67
-
68
-
69
-
70
-
71
-
72
-
73
-
74
-
75
-
76
-
77
-
78
-
79
-
80
-
81
-
82
-
83
-
84
-
85
-
86
-
87
-
88
-
89
-
90
-
91
-
92
-
93
-
94
-
95
-
96
-
97
-
98
-
99
-
100
-
101
-
102
-
103
-
104
-
105
-
106
-
107
-
108
-
109
-
110
-
111
-
112
-
113
-
114
-
115
-
116
-
117
-
118
-
119
-
120
-
121
-
122
-
123
-
124
-
125
-
126
-
127
-
128
-
129
-
130
-
131
-
132
-
133
-
134
-
135
-
136
 |
 |

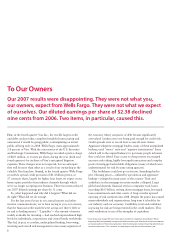
7
• Wells Fargo Home Mortgage had a relatively good year and
was the nation’s #1 retail mortgage originator for the 15th
consecutive year despite the sharp housing downturn and
turbulent secondary markets. Mortgage originations declined
seven percent to $272 billion, but our owned home mortgage
servicing (processing the monthly payments of your home loan)
portfolio reached $1.53 trillion, up 12 percent from 2006.
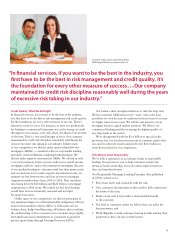
Growth Opportunities
As we’ve said for years, our greatest opportunities for growth are
right in front of us: satisfying all our customers’ financial needs
and helping them succeed financially. Here’s a progress report on
three of our biggest growth opportunities: wealth management,
insurance and business banking.
Wealth Management Group Our #1 strategic initiative is to grow
our investments and insurance businesses to 25 percent of our
company’s total earnings. We continue to make good progress.
The total assets we managed in our Wealth Management Group
— Investment Management, Insurance, Brokerage, Trust and
Estate, and Private Banking — grew 10 percent in 2007. We
want to give our highest-value customers the most personalized
service possible. To that end, we introduced Wells Fargo Private
Bank across the country, including several markets outside
our 23 Community Banking states. The Private Bank provides
personalized wealth management solutions for clients with
$1 million or more in Wells Fargo relationship balances,
excluding mortgages. Our dedicated relationship teams help
clients manage their daily financial needs, preserve and build
wealth, achieve philanthropic goals and build a legacy for
future generations.
Our Wealth Management Group grew core deposits 28 percent
and loans 15 percent — and our offer of 100 commission-free
trades through WellsTrade®online brokerage for our Wells Fargo®
PMA®Package customers helped us grow self-directed brokerage
assets under administration by 35 percent. We also launched The
Private Bank online, which generated significant new balances.
Insurance We’re the world’s fifth-largest insurance brokerage,
third-largest U.S. commercial insurance brokerage, and the
largest bank-owned U.S. insurance brokerage, but we’re a long
way from being #1 for all our customers’ insurance needs. The
revenue also grew faster than our expenses (up 9.5 percent),
which we consider the best long-term measure of a company’s
efficiency. Our return on equity (after-tax profit for every
shareholder dollar) was a very respectable 17.1 percent. Most
of our businesses achieved very solid financial results. Among
their achievements:
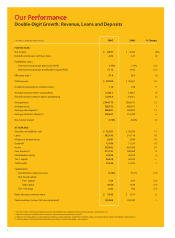
• Wholesale Banking – Record net income of $2.3 billion, up
13 percent, and revenue up 15 percent, its ninth consecutive
year of double-digit growth. Average loans rose 20 percent.
Cross-sell reached a record 6.1 products per Wholesale
customer relationship (4.9 five years ago) and 7.6 products
per middle-market commercial banking relationship. Almost
a third of our regional commercial banking offices had
more than eight products per relationship. Some averaged
more than 10!
• Asset Management Group – Double-digit growth in revenue,
earnings and assets under management. Wells Fargo Advantage
Funds®— with assets up 24 percent — is the nation’s third-
largest fund manager among banks.
• Community Banking – Revenue up 11 percent, average loans
up nine percent, average retail core deposits up six percent,
record retail bank household cross-sell of 5.5 products per
household (5.2 a year ago, about three, nine years ago), and
we opened 87 new banking stores. One of every five of our
retail banking customers has more than eight products with
us, and in our top region almost one of every three customers
does. Core product solutions (checking, savings, credit cards
and referrals of mortgage, insurance and brokerage) rose
11 percent, 16 percent in California. Wells Fargo Packages®
sales (checking account and at least three other products)
rose 21 percent — purchased by almost three of every four
of our new checking customers. Consumer checking accounts
rose a net 4.7 percent.
• Team member engagement – An important leading indicator
of satisfied customers who give us more of their business —
rose again. Our ratio of engaged to actively disengaged team
members in Community Banking now stands at 8.5 to 1 (7.1
to 1 last year, 2.5 to 1 five years ago) — the fifth consecutive
year of improvement. The national average for all surveyed
companies is only 2 to 1.
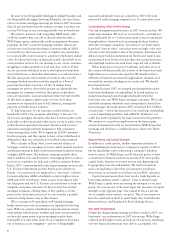
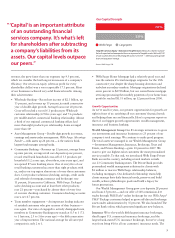
“ ‘Capital’ is an important attribute
of an outstanding financial
services company. It’s what’s left
for shareholders after subtracting
a company’s liabilities from its
assets. Our capital levels outpace
our peers.”
7. 0 %
5.0 %
Tangible Common Equity + Allowance/Tangible Assets Measures a bank’s “cushion”
for both expected and unexpected losses as a percent of tangible assets. We had $7.00
of such cushion for every $100 of tangible assets (12/31/07) — 200 basis points greater
than our large peers’ average.
Wells Fargo Large peers
Source: Wells Fargo, SNL
Our Capital Strength