Wells Fargo 2007 Annual Report Download - page 91
Download and view the complete annual report
Please find page 91 of the 2007 Wells Fargo annual report below. You can navigate through the pages in the report by either clicking on the pages listed below, or by using the keyword search tool below to find specific information within the annual report.-
 1
1 -
2
-
3
-
4
-
5
-
6
-
7
-
8
-
9
-
10
-
11
-
12
-
13
-
14
-
15
-
16
-
17
-
18
-
19
-
20
-
21
-
22
-
23
-
24
-
25
-
26
-
27
-
28
-
29
-
30
-
31
-
32
-
33
-
34
-
35
-
36
-
37
-
38
-
39
-
40
-
41
-
42
-
43
-
44
-
45
-
46
-
47
-
48
-
49
-
50
-
51
-
52
-
53
-
54
-
55
-
56
-
57
-
58
-
59
-
60
-
61
-
62
-
63
-
64
-
65
-
66
-
67
-
68
-
69
-
70
-
71
-
72
-
73
-
74
-
75
-
76
-
77
-
78
-
79
-
80
-
 81
81 -
 82
82 -
 83
83 -
 84
84 -
 85
85 -
 86
86 -
 87
87 -
 88
88 -
 89
89 -
 90
90 -
 91
91 -
 92
92 -
 93
93 -
 94
94 -
 95
95 -
 96
96 -
 97
97 -
 98
98 -
 99
99 -
 100
100 -
 101
101 -
102
-
103
-
104
-
105
-
106
-
107
-
108
-
109
-
110
-
111
-
112
-
113
-
114
-
115
-
116
-
117
-
118
-
119
-
120
-
121
-
122
-
123
-
124
-
125
-
126
-
127
-
128
-
129
-
130
-
131
-
132
-
133
-
134
-
135
-
136
 |
 |

88
single area consisting of more than 3% of total loans. Changes
in real estate values and underlying economic conditions for
these areas are monitored continuously within our credit
risk management process. In 2007, the residential real estate
markets experienced significant declines in property values,
and several markets in California, specifically the Central
Valley and several Southern California metropolitan
statistical areas, experienced more severe value adjustments.
Some of our real estate 1-4 family mortgage loans,
including first mortgage and home equity products, include
an interest-only feature as part of the loan terms. At December 31,
2007, such loans were approximately 20% of total loans,
compared with 19% at December 31, 2006. Substantially
all of these loans are considered to be prime or near prime.
We do not make or purchase option adjustable-rate mortgage
products, nor do we make or purchase variable-rate mortgage
products with fixed payment amounts, commonly referred
to within the financial services industry as negative amortizing
mortgage loans.
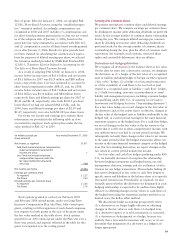
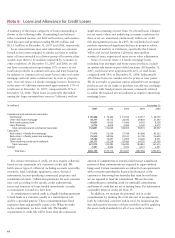
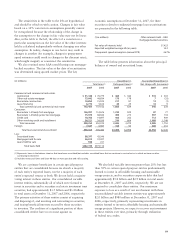
A summary of the major categories of loans outstanding is
shown in the following table. Outstanding loan balances
reflect unearned income, net deferred loan fees, and unamor-
tized discount and premium totaling $4,083 million and
$3,113 million at December 31, 2007 and 2006, respectively.
Loan concentrations may exist when there are amounts
loaned to borrowers engaged in similar activities or similar
types of loans extended to a diverse group of borrowers that
would cause them to be similarly impacted by economic or
other conditions. At December 31, 2007 and 2006, we did
not have concentrations representing 10% or more of our
total loan portfolio in commercial loans and lease financing
by industry or commercial real estate loans (other real estate
mortgage and real estate construction) by state or property
type. Our real estate 1-4 family mortgage loans to borrowers
in the state of California represented approximately 13% of
total loans at December 31, 2007, compared with 11% at
December 31, 2006. These loans are generally diversified
among the larger metropolitan areas in California, with no
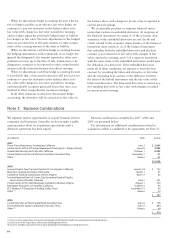
Note 6: Loans and Allowance for Credit Losses
(in millions) December 31,
2007 2006 2005 2004 2003
Commercial and commercial real estate:
Commercial $ 90,468 $ 70,404 $ 61,552 $ 54,517 $ 48,729
Other real estate mortgage 36,747 30,112 28,545 29,804 27,592
Real estate construction 18,854 15,935 13,406 9,025 8,209
Lease financing 6,772 5,614 5,400 5,169 4,477
Total commercial and commercial real estate 152,841 122,065 108,903 98,515 89,007
Consumer:
Real estate 1-4 family first mortgage 71,415 53,228 77,768 87,686 83,535
Real estate 1-4 family junior lien mortgage 75,565 68,926 59,143 52,190 36,629
Credit card 18,762 14,697 12,009 10,260 8,351
Other revolving credit and installment 56,171 53,534 47,462 34,725 33,100
Total consumer 221,913 190,385 196,382 184,861 161,615
Foreign 7,441 6,666 5,552 4,210 2,451
Total loans $382,195 $319,116 $310,837 $287,586 $253,073
For certain extensions of credit, we may require collateral,
based on our assessment of a customer’s credit risk. We
hold various types of collateral, including accounts receivable,
inventory, land, buildings, equipment, autos, financial
instruments, income-producing commercial properties and
residential real estate. Collateral requirements for each customer
may vary according to the specific credit underwriting,
terms and structure of loans funded immediately or under
a commitment to fund at a later date.
A commitment to extend credit is a legally binding agreement
to lend funds to a customer, usually at a stated interest rate
and for a specified purpose. These commitments have fixed
expiration dates and generally require a fee. When we make
such a commitment, we have credit risk. The liquidity
requirements or credit risk will be lower than the contractual
amount of commitments to extend credit because a significant
portion of these commitments are expected to expire without
being used. Certain commitments are subject to loan agreements
with covenants regarding the financial performance of the
customer or borrowing base formulas that must be met before
we are required to fund the commitment. We use the same
credit policies in extending credit for unfunded commitments
and letters of credit that we use in making loans. For information
on standby letters of credit, see Note 15.
In addition, we manage the potential risk in credit
commitments by limiting the total amount of arrangements,
both by individual customer and in total, by monitoring the
size and maturity structure of these portfolios and by applying
the same credit standards for all of our credit activities.