Wells Fargo 2007 Annual Report Download - page 107
Download and view the complete annual report
Please find page 107 of the 2007 Wells Fargo annual report below. You can navigate through the pages in the report by either clicking on the pages listed below, or by using the keyword search tool below to find specific information within the annual report.-
 1
1 -
2
-
3
-
4
-
5
-
6
-
7
-
8
-
9
-
10
-
11
-
12
-
13
-
14
-
15
-
16
-
17
-
18
-
19
-
20
-
21
-
22
-
23
-
24
-
25
-
26
-
27
-
28
-
29
-
30
-
31
-
32
-
33
-
34
-
35
-
36
-
37
-
38
-
39
-
40
-
41
-
42
-
43
-
44
-
45
-
46
-
47
-
48
-
49
-
50
-
51
-
52
-
53
-
54
-
55
-
56
-
57
-
58
-
59
-
60
-
61
-
62
-
63
-
64
-
65
-
66
-
67
-
68
-
69
-
70
-
71
-
72
-
73
-
74
-
75
-
76
-
77
-
78
-
79
-
80
-
81
-
82
-
83
-
84
-
85
-
86
-
87
-
88
-
89
-
90
-
91
-
92
-
93
-
94
-
95
-
96
-
 97
97 -
 98
98 -
 99
99 -
 100
100 -
 101
101 -
 102
102 -
 103
103 -
 104
104 -
 105
105 -
 106
106 -
 107
107 -
 108
108 -
 109
109 -
 110
110 -
 111
111 -
 112
112 -
 113
113 -
 114
114 -
 115
115 -
 116
116 -
 117
117 -
118
-
119
-
120
-
121
-
122
-
123
-
124
-
125
-
126
-
127
-
128
-
129
-
130
-
131
-
132
-
133
-
134
-
135
-
136
 |
 |

104
(in millions) December 31,
2007 2006
Notional or Credit Estimated Notional or Credit Estimated
contractual risk net fair contractual risk net fair
amount amount(2) value amount amount(2) value
ASSET/LIABILITY MANAGEMENT HEDGES
Qualifying hedge contracts
accounted for under FAS 133
Interest rate contracts:
Swaps $ 47,408 $1,411 $1,144 $ 36,840 $ 530 $ 158
Futures 50 — — 339 — —
Floors and caps purchased 25088 50055
Floors and caps written 250 — (5) ———
Options purchased ——— ———
Forwards ——— 27,781 86 36
Equity contracts:
Options purchased 1—— 1——
Options written 3— (3) 75 — (15)
Forwards ——— 4——
Foreign exchange contracts:
Swaps 12,048 1,399 1,376 10,157 548 539
Free-standing derivatives
(economic hedges)
Interest rate contracts (1):
Swaps 43,835 933 512 29,674 164 39
Futures 56,023 — — 61,339 — —
Options purchased 16,250 156 156 94,101 157 157
Options written 3,500 — (20) 11,620 — (5)
Forwards 353,095 1,094 807 260,751 394 (8)
Foreign exchange contracts:
Swaps 603 202 202 603 87 87
Forwards ——— 1,000 49 —
CUSTOMER ACCOMMODATION,
TRADING AND OTHER
FREE-STANDING DERIVATIVES
Interest rate contracts:
Swaps 195,144 3,584 388 100,944 1,286 230
Futures 33,443 — — 16,870 — —
Floors and caps purchased 21,629 143 143 6,929 30 30
Floors and caps written 24,466 — (124) 10,704 — (20)
Options purchased 2,573 88 88 8,993 102 102
Options written 19,074 35 (60) 31,237 15 (133)
Forwards 131,959 43 9 83,163 21 5
Commodity contracts:
Swaps 5,053 367 (48) 3,422 277 34
Futures 1,417 — — 518 — —
Floors and caps purchased 1,869 290 290 839 55 55
Floors and caps written 1,738 — (151) 1,224 — (66)
Options purchased 761 74 74 184 30 30
Options written 552 — (49) 155 — (31)
Equity contracts:
Swaps 291 63 19 8141
Futures 138 — — 90 — —
Options purchased 4,966 508 508 2,732 295 295
Options written 4,416 — (433) 2,113 — (302)
Forwards 74 — (8) 160 1 (7)
Foreign exchange contracts:
Swaps 5,797 199 (20) 4,133 40 (17)
Futures 155 — — 1——
Options purchased 3,229 107 107 2,384 72 72
Options written 3,168 — (100) 2,145 — (55)
Forwards and spots 40,371 420 85 34,576 194 19
Credit contracts:
Swaps 2,752 75 51 1,513 30 3
(1) Includes free-standing derivatives (economic hedges) used to hedge the risk of changes in the fair value of residential MSRs, MHFS, interest rate lock commitments and
other interests held.
(2) Credit risk amounts reflect the replacement cost for those contracts in a gain position in the event of nonperformance by all counterparties.
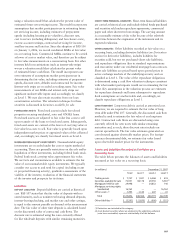
The total notional or contractual amounts, credit risk amount and estimated net fair value for derivatives were: