Wells Fargo 2007 Annual Report Download - page 62
Download and view the complete annual report
Please find page 62 of the 2007 Wells Fargo annual report below. You can navigate through the pages in the report by either clicking on the pages listed below, or by using the keyword search tool below to find specific information within the annual report.-
 1
1 -
2
-
3
-
4
-
5
-
6
-
7
-
8
-
9
-
10
-
11
-
12
-
13
-
14
-
15
-
16
-
17
-
18
-
19
-
20
-
21
-
22
-
23
-
24
-
25
-
26
-
27
-
28
-
29
-
30
-
31
-
32
-
33
-
34
-
35
-
36
-
37
-
38
-
39
-
40
-
41
-
42
-
43
-
44
-
45
-
46
-
47
-
48
-
49
-
50
-
51
-
 52
52 -
 53
53 -
 54
54 -
 55
55 -
 56
56 -
 57
57 -
 58
58 -
 59
59 -
 60
60 -
 61
61 -
 62
62 -
 63
63 -
 64
64 -
 65
65 -
 66
66 -
 67
67 -
 68
68 -
 69
69 -
 70
70 -
 71
71 -
 72
72 -
73
-
74
-
75
-
76
-
77
-
78
-
79
-
80
-
81
-
82
-
83
-
84
-
85
-
86
-
87
-
88
-
89
-
90
-
91
-
92
-
93
-
94
-
95
-
96
-
97
-
98
-
99
-
100
-
101
-
102
-
103
-
104
-
105
-
106
-
107
-
108
-
109
-
110
-
111
-
112
-
113
-
114
-
115
-
116
-
117
-
118
-
119
-
120
-
121
-
122
-
123
-
124
-
125
-
126
-
127
-
128
-
129
-
130
-
131
-
132
-
133
-
134
-
135
-
136
 |
 |
59
sourced through wholesale (brokers) and correspondents. Our
real estate 1-4 family first mortgage portfolio continued to
perform well, with net charge-offs of $87 million (0.14% of
average loans) for 2007, up from $77 million (0.13%) for 2006.
Because of our responsible lending and risk management
practices, we have not faced many of the issues others have
in the mortgage industry. We do not make or purchase any
negative amortizing mortgages, including option ARMs.
We have minimal ARM reset risk across our owned loan
portfolios. While our disciplined underwriting standards
have resulted in first mortgage delinquencies below industry
levels, we continued to tighten our underwriting standards
in the last half of 2007. Home Mortgage closed its nonprime
wholesale channel early in third quarter, after closing its
nonprime correspondent channel in second quarter 2007.
Rates were increased for non-conforming mortgage loans
during third quarter reflecting the reduced liquidity in the
capital markets.
Credit quality in Wells Fargo Financial’s real estate-
secured lending business has not experienced the level of
credit degradation that many nonprime lenders have because
of our disciplined underwriting practices. Wells Fargo
Financial does not use brokers or correspondents in its U.S.
debt consolidation business. We endeavor to ensure that there
is a tangible benefit to the borrower before we make a loan.
The recent guidance issued by the federal financial regulatory
agencies in June 2007, Statement on Subprime Mortgage
Lending, which addresses issues relating to certain ARM
products, will not have a significant impact on Wells Fargo
Financial’s operations, since many of those guidelines have
long been part of our normal business practices.
Higher net charge-offs in non-real estate consumer loans
(credit card and other revolving credit and installment) were
primarily due to increases in the indirect auto portfolio, with
auto net charge-offs for 2007 up $164 million from 2006.
The increase in all other consumer portfolios, including credit
cards, was due to an overall weakening in the economy.
Credit performance in the commercial and commercial
real estate portfolio remained strong, with net charge-offs
of $536 million (0.40% of average loans), compared with
$297 million (0.26%) in 2006. As is typical, the vast majority
of these charge-offs came from loans originated through our
business direct channel. Business direct consists primarily of
unsecured lines of credit to small firms and properties that
tend to perform in a manner similar to credit cards. Because
of our Wholesale Banking business model, focused primarily
on business customers, we do not actively participate in
certain higher-risk activities. Our capital market business
was largely not impacted by the credit crunch or market
dislocations in 2007, including industry problem areas of
CDOs, CLOs and SIVs. On the investment side of this
business, we operate within disciplined credit standards
and regularly monitor and manage our securities portfolios.
From an underwriting standpoint, we have not participated
in a significant way in any of the large leveraged buyouts
that were “covenant lite” and we have minimal direct expo-
sure to hedge funds. Similarly, we have not made a market in
subprime securities. Leveraged-buyout-related outstandings
are diversified by business and borrower and totaled less than
2% of total Wells Fargo loans. Our residential real estate
development portfolio of approximately $6 billion, or 2% of
total loans, continued to perform in a satisfactory manner.
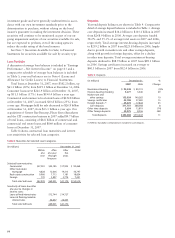
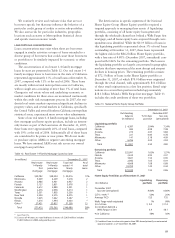
Table 18 presents the allocation of the allowance for
credit losses by type of loans. The $1.55 billion increase in
the allowance for credit losses from year-end 2006 to year-end
2007 was due to actions taken in 2007 primarily related to
the Home Equity portfolio and approximately $100 million
acquired from bank acquisitions. The decrease of $93 million
in the allowance for credit losses from year-end 2005 to
year-end 2006 was primarily due to the release of the
remaining portion of the provision made for Hurricane
Katrina in 2005. Changes in the allowance reflect changes in
statistically derived loss estimates, historical loss experience,
current trends in borrower risk and/or general economic
activity on portfolio performance, and management’s estimate
for imprecision and uncertainty. Effective December 31, 2006,
the entire allowance was assigned to individual portfolio types
to better reflect our view of risk in these portfolios. The
allowance for credit losses includes a combination of base-
line loss estimates and a range of imprecision or uncertainty
specific to each portfolio segment previously categorized as
unallocated in prior years.