Wells Fargo 2007 Annual Report Download - page 110
Download and view the complete annual report
Please find page 110 of the 2007 Wells Fargo annual report below. You can navigate through the pages in the report by either clicking on the pages listed below, or by using the keyword search tool below to find specific information within the annual report.-
 1
1 -
2
-
3
-
4
-
5
-
6
-
7
-
8
-
9
-
10
-
11
-
12
-
13
-
14
-
15
-
16
-
17
-
18
-
19
-
20
-
21
-
22
-
23
-
24
-
25
-
26
-
27
-
28
-
29
-
30
-
31
-
32
-
33
-
34
-
35
-
36
-
37
-
38
-
39
-
40
-
41
-
42
-
43
-
44
-
45
-
46
-
47
-
48
-
49
-
50
-
51
-
52
-
53
-
54
-
55
-
56
-
57
-
58
-
59
-
60
-
61
-
62
-
63
-
64
-
65
-
66
-
67
-
68
-
69
-
70
-
71
-
72
-
73
-
74
-
75
-
76
-
77
-
78
-
79
-
80
-
81
-
82
-
83
-
84
-
85
-
86
-
87
-
88
-
89
-
90
-
91
-
92
-
93
-
94
-
95
-
96
-
97
-
98
-
99
-
 100
100 -
 101
101 -
 102
102 -
 103
103 -
 104
104 -
 105
105 -
 106
106 -
 107
107 -
 108
108 -
 109
109 -
 110
110 -
 111
111 -
 112
112 -
 113
113 -
 114
114 -
 115
115 -
 116
116 -
 117
117 -
 118
118 -
 119
119 -
 120
120 -
121
-
122
-
123
-
124
-
125
-
126
-
127
-
128
-
129
-
130
-
131
-
132
-
133
-
134
-
135
-
136
 |
 |

107
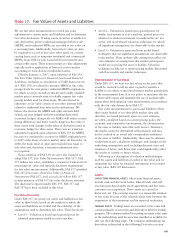
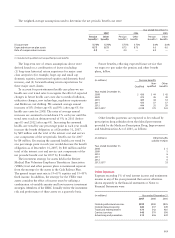
(in millions) December 31, 2007
Total Level 1 Level 2 Level 3
Trading assets $ 7,727 $ 1,041 $ 6,268 $ 418
Securities available for sale 72,951 38,178 29,392 5,381(2)
Mortgages held for sale 24,998 — 24,852 146
Mortgage servicing rights
(residential) 16,763 — — 16,763
Other assets (1) 1,393 1,145 207 41
Total $123,832 $40,364 $60,719 $22,749
Other liabilities (1) $ (2,591) $ (1,670) $ (606) $ (315)
(1) Derivatives are included in this category.
(2) Asset-backed securities where we underwrite the underlying collateral
(auto lease receivables) represent substantially all of this balance.
using a valuation model that calculates the present value of
estimated future net servicing income. The model incorporates
assumptions that market participants use in estimating future
net servicing income, including estimates of prepayment
speeds (including housing price volatility), discount rate,
cost to service (including delinquency and foreclosure costs),
escrow account earnings, contractual servicing fee income,
ancillary income and late fees. Since the adoption of FAS 156
on January 1, 2006, we record residential MSRs at fair value
on a recurring basis. Commercial MSRs continue to be carried
at lower of cost or market value, and therefore can be subject
to fair value measurements on a nonrecurring basis. For other
interests held in securitizations (such as interest-only strips)
we use a valuation model that calculates the present value
of estimated future cash flows. The model incorporates our
own estimates of assumptions market participants use in
determining the fair value, including estimates of prepayment
speeds, discount rates, defaults and contractual fee income.
Interest-only strips are recorded as trading assets. Fair value
measurements of our MSRs and interest-only strips use
significant unobservable inputs and, accordingly, we classify
as Level 3. We may also retain securities from our loan
securitization activities. The valuation technique for these
securities is discussed in Securities available for sale.
FORECLOSED ASSETS Foreclosed assets include foreclosed
properties securing residential, auto and GNMA loans.
Foreclosed assets are adjusted to fair value less costs to sell
upon transfer of the loans to foreclosed assets. Subsequently,
foreclosed assets are carried at the lower of carrying value or
fair value less costs to sell. Fair value is generally based upon
independent market prices or appraised values of the collateral
and, accordingly, we classify foreclosed assets as Level 2.
NONMARKETABLE EQUITY INVESTMENTS Nonmarketable equity
investments are recorded under the cost or equity method of
accounting. There are generally restrictions on the sale and/or
liquidation of these investments, including federal bank stock.
Federal bank stock carrying value approximates fair value.
We use facts and circumstances available to estimate the fair
value of our nonmarketable equity investments. We typically
consider our access to and need for capital (including recent
or projected financing activity), qualitative assessments of the
viability of the investee, evaluation of the financial statements
of the investee and prospects for its future.
Liabilities
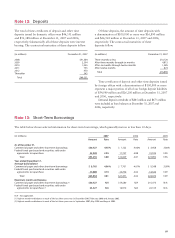
DEPOSIT LIABILITIES Deposit liabilities are carried at historical
cost. FAS 107 states that the fair value of deposits with no
stated maturity, such as noninterest-bearing demand deposits,
interest-bearing checking, and market rate and other savings,
is equal to the amount payable on demand at the measurement
date. The fair value of other time deposits is calculated based
on the discounted value of contractual cash flows. The
discount rate is estimated using the rates currently offered
for like wholesale deposits with similar remaining maturities.
SHORT-TERM FINANCIAL LIABILITIES Short-term financial liabilities
are carried at historical cost and include federal funds purchased
and securities sold under repurchase agreements, commercial
paper and other short-term borrowings. The carrying amount
is a reasonable estimate of fair value because of the relatively
short time between the origination of the instrument and its
expected realization.
OTHER LIABILITIES Other liabilities recorded at fair value on a
recurring basis, excluding derivative liabilities (see Derivatives
section for derivative liabilities), includes liabilities for
securities sold, but not yet purchased (short sale liabilities),
and repurchase obligations (due to standard representations
and warranties) under our residential mortgage loan contracts.
Short sale liabilities are priced based upon quoted prices in
active exchange markets of the underlying security and are
classified as Level 1. The value of the repurchase obligations
is determined using a cash flow valuation technique consistent
with what market participants would use in estimating the fair
value. Key assumptions in the valuation process are estimates
for repurchase demands and losses subsequent to repurchase.
Such assumptions are unobservable and, accordingly, we
classify repurchase obligations as Level 3.
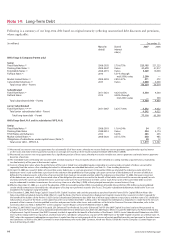
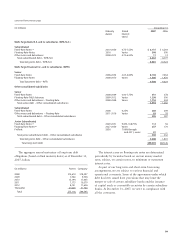
LONG-TERM DEBT Long-term debt is carried at amortized cost.
However, we are required to estimate the fair value of long-
term debt under FAS 107. Generally, the discounted cash flow
method is used to estimate the fair value of our long-term
debt. Contractual cash flows are discounted using rates
currently offered for new notes with similar remaining
maturities and, as such, these discount rates include our
current spread levels. The fair value estimates generated are
corroborated against observable market prices. For foreign-
currency denominated debt, we estimate fair value based
upon observable market prices for the instruments.
Assets and Liabilities Recorded at Fair Value on a
Recurring Basis
The table below presents the balances of assets and liabilities
measured at fair value on a recurring basis.