Wells Fargo 2007 Annual Report Download - page 96
Download and view the complete annual report
Please find page 96 of the 2007 Wells Fargo annual report below. You can navigate through the pages in the report by either clicking on the pages listed below, or by using the keyword search tool below to find specific information within the annual report.-
 1
1 -
2
-
3
-
4
-
5
-
6
-
7
-
8
-
9
-
10
-
11
-
12
-
13
-
14
-
15
-
16
-
17
-
18
-
19
-
20
-
21
-
22
-
23
-
24
-
25
-
26
-
27
-
28
-
29
-
30
-
31
-
32
-
33
-
34
-
35
-
36
-
37
-
38
-
39
-
40
-
41
-
42
-
43
-
44
-
45
-
46
-
47
-
48
-
49
-
50
-
51
-
52
-
53
-
54
-
55
-
56
-
57
-
58
-
59
-
60
-
61
-
62
-
63
-
64
-
65
-
66
-
67
-
68
-
69
-
70
-
71
-
72
-
73
-
74
-
75
-
76
-
77
-
78
-
79
-
80
-
81
-
82
-
83
-
84
-
85
-
 86
86 -
 87
87 -
 88
88 -
 89
89 -
 90
90 -
 91
91 -
 92
92 -
 93
93 -
 94
94 -
 95
95 -
 96
96 -
 97
97 -
 98
98 -
 99
99 -
 100
100 -
 101
101 -
 102
102 -
 103
103 -
 104
104 -
 105
105 -
 106
106 -
107
-
108
-
109
-
110
-
111
-
112
-
113
-
114
-
115
-
116
-
117
-
118
-
119
-
120
-
121
-
122
-
123
-
124
-
125
-
126
-
127
-
128
-
129
-
130
-
131
-
132
-
133
-
134
-
135
-
136
 |
 |

93
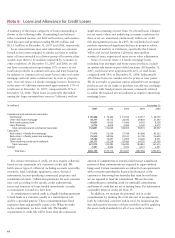
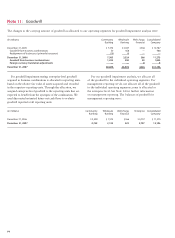
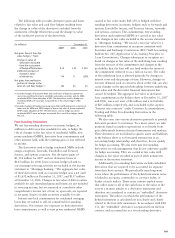
(in millions) December 31, Year ended December 31,
Total loans(1) Delinquent loans(2) Net charge-offs (recoveries)
2007 2006 2007 2006 2007 2006
Commercial and commercial real estate:
Commercial $ 91,186 $ 70,779 $ 464 $ 346 $ 510 $ 303
Other real estate mortgage 75,642 44,834 179 178 7(33)
Real estate construction 18,854 15,935 317 81 12 (1)
Lease financing 6,772 5,614 45 29 16 9
Total commercial and commercial real estate 192,454 137,162 1,005 634 545 278
Consumer:
Real estate 1-4 family first mortgage 146,997 114,676 1,745 929 87 77
Real estate 1-4 family junior lien mortgage 75,974 68,926 495 275 597 118
Credit card 18,762 14,697 402 262 712 409
Other revolving credit and installment 56,521 54,036 744 804 1,409 1,148
Total consumer 298,254 252,335 3,386 2,270 2,805 1,752
Foreign 7,647 6,983 104 94 206 210
Total loans owned and securitized 498,355 396,480 $4,495 $2,998 $3,556 $2,240
Less:
Securitized loans 88,397 43,546
Mortgages held for sale 26,815 33,097
Loans held for sale 948 721
Total loans held $382,195 $319,116
(1) Represents loans in the balance sheet or that have been securitized, but excludes securitized loans that we continue to service but as to which we have no other
continuing involvement.
(2) Includes nonaccrual loans and loans 90 days or more past due and still accruing.
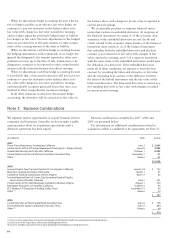
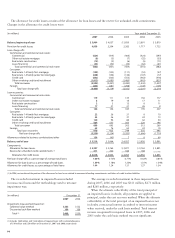
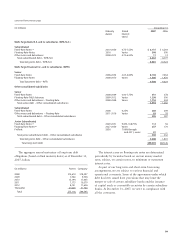
economic assumptions at December 31, 2007, for these
securities related to residential mortgage loan securitizations
are presented in the following table.
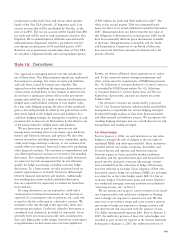
We are a primary beneficiary in certain special-purpose
entities that are consolidated because we absorb a majority
of each entity’s expected losses, receive a majority of each
entity’s expected returns or both. We do not hold a majority
voting interest in these entities. Our consolidated variable
interest entities, substantially all of which were formed to
invest in securities and to securitize real estate investment trust
securities, had approximately $3.5 billion and $3.4 billion
in total assets at December 31, 2007 and 2006, respectively.
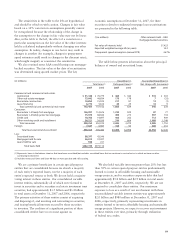
The primary activities of these entities consist of acquiring
and disposing of, and investing and reinvesting in securities,
and issuing beneficial interests secured by those securities
to investors. The creditors of a significant portion of these
consolidated entities have no recourse against us.
We also hold variable interests greater than 20% but less
than 50% in certain special-purpose entities predominantly
formed to invest in affordable housing and sustainable
energy projects, and to securitize corporate debt that had
approximately $5.8 billion and $2.9 billion in total assets
at December 31, 2007 and 2006, respectively. We are not
required to consolidate these entities. Our maximum
exposure to loss as a result of our involvement with these
unconsolidated variable interest entities was approximately
$2.0 billion and $980 million at December 31, 2007 and
2006, respectively, primarily representing investments in
entities formed to invest in affordable housing and sustainable
energy projects. However, we expect to recover our investment
in these entities over time, primarily through realization
of federal tax credits.
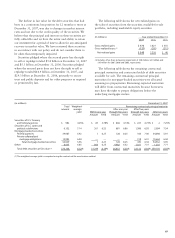
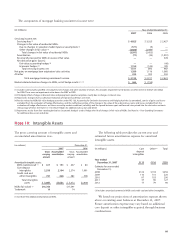
The sensitivities in the table to the left are hypothetical
and should be relied on with caution. Changes in fair value
based on a 10% variation in assumptions generally cannot
be extrapolated because the relationship of the change in
the assumption to the change in fair value may not be linear.
Also, in the table to the left, the effect of a variation in a
particular assumption on the fair value of the other interests
held is calculated independently without changing any other
assumption. In reality, changes in one factor may result in
changes in another (for example, changes in prepayment
speed estimates could result in changes in the discount rates),
which might magnify or counteract the sensitivities.
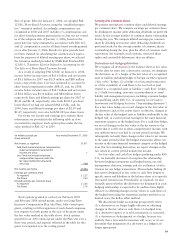
We also retained some AAA-rated floating-rate mortgage-
backed securities. The fair value at the date of securitization
was determined using quoted market prices. The key
($ in millions) Other interests held – AAA
mortgage-backed securities
Fair value of interests held $7,423
Expected weighted-average life (in years) 10.3
Prepayment speed assumption (annual CPR) 26.7%
The table below presents information about the principal
balances of owned and securitized loans.