Wells Fargo 2007 Annual Report Download - page 40
Download and view the complete annual report
Please find page 40 of the 2007 Wells Fargo annual report below. You can navigate through the pages in the report by either clicking on the pages listed below, or by using the keyword search tool below to find specific information within the annual report.-
 1
1 -
2
-
3
-
4
-
5
-
6
-
7
-
8
-
9
-
10
-
11
-
12
-
13
-
14
-
15
-
16
-
17
-
18
-
19
-
20
-
21
-
22
-
23
-
24
-
25
-
26
-
27
-
28
-
29
-
 30
30 -
 31
31 -
 32
32 -
 33
33 -
 34
34 -
 35
35 -
 36
36 -
 37
37 -
 38
38 -
 39
39 -
 40
40 -
 41
41 -
 42
42 -
 43
43 -
 44
44 -
 45
45 -
 46
46 -
 47
47 -
 48
48 -
 49
49 -
 50
50 -
51
-
52
-
53
-
54
-
55
-
56
-
57
-
58
-
59
-
60
-
61
-
62
-
63
-
64
-
65
-
66
-
67
-
68
-
69
-
70
-
71
-
72
-
73
-
74
-
75
-
76
-
77
-
78
-
79
-
80
-
81
-
82
-
83
-
84
-
85
-
86
-
87
-
88
-
89
-
90
-
91
-
92
-
93
-
94
-
95
-
96
-
97
-
98
-
99
-
100
-
101
-
102
-
103
-
104
-
105
-
106
-
107
-
108
-
109
-
110
-
111
-
112
-
113
-
114
-
115
-
116
-
117
-
118
-
119
-
120
-
121
-
122
-
123
-
124
-
125
-
126
-
127
-
128
-
129
-
130
-
131
-
132
-
133
-
134
-
135
-
136
 |
 |

37
adjusted to market value when transferred to nonperforming
asset (NPA) status. Total NPAs were $3.87 billion (1.01% of
total loans) at December 31, 2007, compared with $2.42 billion
(0.76%) at December 31, 2006. Due to illiquid market
conditions, we are now holding more foreclosed properties than
we have historically. Foreclosed assets were $1.18 billion at
December 31, 2007, compared with $745 million at December 31,
2006. Foreclosed assets, a component of total NPAs, included
$649 million and $423 million in residential property or auto
loans and $535 million and $322 million of foreclosed real
estate securing Government National Mortgage Association
(GNMA) loans at December 31, 2007 and 2006, respectively,
consistent with regulatory reporting requirements. The fore-
closed real estate securing GNMA loans of $535 million
represented 14 basis points of the ratio of NPAs to loans at
December 31, 2007. Both principal and interest for the GNMA
loans secured by the foreclosed real estate are collectible
because the GNMA loans are insured by the Federal Housing
Administration (FHA) or guaranteed by the Department of
Veterans Affairs.
regulatory guidelines of 8% and 4%, respectively, for bank
holding companies. Our RBC ratios at December 31, 2006,
were 12.49% and 8.93%, respectively. Our Tier 1 leverage
ratios were 6.83% and 7.88% at December 31, 2007 and
2006, respectively, exceeding the minimum regulatory
guideline of 3% for bank holding companies.
Current Accounting Developments
On January 1, 2007, we adopted the following new
accounting pronouncements:
• FIN 48 – Financial Accounting Standards Board (FASB)
Interpretation No. 48, Accounting for Uncertainty in
Income Taxes, an interpretation of FASB Statement
No. 109;
• FSP 13-2 – FASB Staff Position 13-2, Accounting for a
Change or Projected Change in the Timing of Cash Flows
Relating to Income Taxes Generated by a Leveraged Lease
Transaction;
• FAS 155 – Statement of Financial Accounting Standards
No. 155, Accounting for Certain Hybrid Financial
Instruments, an amendment of FASB Statements
No. 133 and 140;
• FAS 157 – Fair Value Measurements; and
• FAS 159 – The Fair Value Option for Financial Assets and
Financial Liabilities, including an amendment of FASB
Statement No. 115.
The adoption of FIN 48, FAS 155, FAS 157 and FAS 159
did not have any effect on our financial statements at the
date of adoption. For additional information, see Note 17
(Fair Values of Assets and Liabilities) and Note 21 (Income
Taxes) to Financial Statements.
Upon adoption of FSP 13-2, we recorded a cumulative
effect of change in accounting principle to reduce the beginning
balance of 2007 retained earnings by $71 million after tax
($115 million pre tax). This amount will be recognized back
into income over the remaining terms of the affected leases.
On July 1, 2007, we adopted Emerging Issues Task Force
(EITF) Topic D-109, Determining the Nature of a Host
Contract Related to a Hybrid Financial Instrument Issued in
the Form of a Share under FASB Statement No. 133 (Topic
D-109), which provides clarifying guidance as to whether
certain hybrid financial instruments are more akin to debt or
equity, for purposes of evaluating whether the embedded
derivative financial instrument requires separate accounting
under FAS 133, Accounting for Derivative Instruments and
Hedging Activities. In accordance with the transition provi-
sions of Topic D-109, we transferred $1.2 billion of securi-
ties, consisting of investments in preferred stock callable by
the issuer, from trading assets to securities available for sale.
Because the securities were carried at fair value, the adoption
of Topic D-109 did not have any effect on our total stock-
holders’ equity.
On April 30, 2007, the FASB issued Staff Position FIN 39-1,
Amendment of FASB Interpretation No. 39 (FSP FIN 39-1).
FSP FIN 39-1 amends Interpretation No. 39 to permit a
reporting entity to offset the right to reclaim cash collateral
(a receivable), or the obligation to return cash collateral
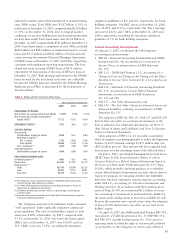
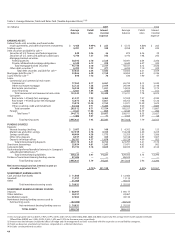
Table 2: Ratios and Per Common Share Data
Year ended December 31,
2007 2006 2005
PROFITABILITY RATIOS
Net income to average total assets (ROA) 1.55% 1.73% 1.72%
Net income to average stockholders’
equity (ROE) 17.12 19.52 19.59
EFFICIENCY RATIO (1) 57.9 58.4 57.7
CAPITAL RATIOS
At year end:
Stockholders’ equity to assets 8.28 9.51 8.44
Risk-based capital (2)
Tier 1 capital 7.59 8.93 8.26
Total capital 10.68 12.49 11.64
Tier 1 leverage (2) 6.83 7.88 6.99
Average balances:
Stockholders’ equity to assets 9.04 8.88 8.78
PER COMMON SHARE DATA
Dividend payout (3) 49.0 43.2 44.1
Book value $14.45 $13.57 $12.12
Market price (4)
High $37.99 $36.99 $32.35
Low 29.29 30.31 28.81
Year end 30.19 35.56 31.42
(1) The efficiency ratio is noninterest expense divided by total revenue (net
interest income and noninterest income).
(2) See Note 26 (Regulatory and Agency Capital Requirements) to Financial
Statements for additional information.
(3) Dividends declared per common share as a percentage of earnings per
common share.
(4) Based on daily prices reported on the New York Stock Exchange Composite
Transaction Reporting System.
The Company and each of its subsidiary banks remained
“well capitalized” under applicable regulatory capital ade-
quacy guidelines. The ratio of stockholders’ equity to total
assets was 8.28% at December 31, 2007, compared with
9.51% at December 31, 2006. Our total risk-based capital
(RBC) ratio at December 31, 2007, was 10.68% and our
Tier 1 RBC ratio was 7.59%, exceeding the minimum