Wells Fargo 2007 Annual Report Download - page 133
Download and view the complete annual report
Please find page 133 of the 2007 Wells Fargo annual report below. You can navigate through the pages in the report by either clicking on the pages listed below, or by using the keyword search tool below to find specific information within the annual report.-
 1
1 -
2
-
3
-
4
-
5
-
6
-
7
-
8
-
9
-
10
-
11
-
12
-
13
-
14
-
15
-
16
-
17
-
18
-
19
-
20
-
21
-
22
-
23
-
24
-
25
-
26
-
27
-
28
-
29
-
30
-
31
-
32
-
33
-
34
-
35
-
36
-
37
-
38
-
39
-
40
-
41
-
42
-
43
-
44
-
45
-
46
-
47
-
48
-
49
-
50
-
51
-
52
-
53
-
54
-
55
-
56
-
57
-
58
-
59
-
60
-
61
-
62
-
63
-
64
-
65
-
66
-
67
-
68
-
69
-
70
-
71
-
72
-
73
-
74
-
75
-
76
-
77
-
78
-
79
-
80
-
81
-
82
-
83
-
84
-
85
-
86
-
87
-
88
-
89
-
90
-
91
-
92
-
93
-
94
-
95
-
96
-
97
-
98
-
99
-
100
-
101
-
102
-
103
-
104
-
105
-
106
-
107
-
108
-
109
-
110
-
111
-
112
-
113
-
114
-
115
-
116
-
117
-
118
-
119
-
120
-
121
-
122
-
 123
123 -
 124
124 -
 125
125 -
 126
126 -
 127
127 -
 128
128 -
 129
129 -
 130
130 -
 131
131 -
 132
132 -
 133
133 -
 134
134 -
 135
135 -
 136
136
 |
 |

130
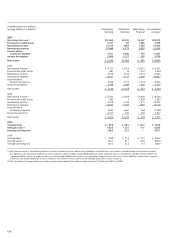
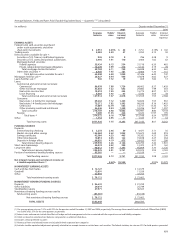
Quarterly Financial Data
Condensed Consolidated Statement of Income — Quarterly (Unaudited)
(in millions, except per share amounts) 2007 2006
Quarter ended Quarter ended
Dec. 31 Sept. 30
(1)
June 30 Mar. 31 Dec. 31 Sept. 30 June 30
(1)
Mar. 31
INTEREST INCOME $ 9,242 $ 9,223 $ 8,573 $ 8,139 $ 8,231 $ 8,399 $ 8,077 $ 7,532
INTEREST EXPENSE 3,754 3,943 3,377 3,129 3,181 3,352 3,093 2,662
NET INTEREST INCOME 5,488 5,280 5,196 5,010 5,050 5,047 4,984 4,870
Provision for credit losses 2,612 892 720 715 726 613 432 433
Net interest income after provision for credit losses 2,876 4,388 4,476 4,295 4,324 4,434 4,552 4,437
NONINTEREST INCOME
Service charges on deposit accounts 788 837 740 685 695 707 665 623
Trust and investment fees 802 777 839 731 735 664 675 663
Card fees 588 561 517 470 481 464 418 384
Other fees 577 566 638 511 550 509 510 488
Mortgage banking 831 823 689 790 677 484 735 415
Operating leases 153 171 187 192 190 192 200 201
Insurance 370 329 432 399 299 313 364 364
Net gains (losses) on debt securities available for sale 60 160 (42) 31 51 121 (156) (35)
Net gains from equity investments 222 173 242 97 256 159 133 190
Other 326 176 453 525 429 274 261 392
Total noninterest income 4,717 4,573 4,695 4,431 4,363 3,887 3,805 3,685
NONINTEREST EXPENSE
Salaries 2,055 1,933 1,907 1,867 1,812 1,769 1,754 1,672
Incentive compensation 840 802 900 742 793 710 714 668
Employee benefits 558 518 581 665 501 458 487 589
Equipment 370 295 292 337 339 294 284 335
Net occupancy 413 398 369 365 367 357 345 336
Operating leases 124 136 148 153 157 155 157 161
Other 1,540 1,589 1,530 1,397 1,442 1,338 1,530 1,313
Total noninterest expense 5,900 5,671 5,727 5,526 5,411 5,081 5,271 5,074
INCOME BEFORE INCOME TAX EXPENSE 1,693 3,290 3,444 3,200 3,276 3,240 3,086 3,048
Income tax expense 332 1,117 1,165 956 1,095 1,046 1,059 1,030
NET INCOME $ 1,361 $ 2,173 $ 2,279 $ 2,244 $ 2,181 $ 2,194 $ 2,027 $ 2,018
EARNINGS PER COMMON SHARE $ 0.41 $ 0.65 $ 0.68 $ 0.66 $ 0.65 $ 0.65 $ 0.60 $ 0.60
DILUTED EARNINGS PER COMMON SHARE $ 0.41 $ 0.64 $ 0.67 $ 0.66 $ 0.64 $ 0.64 $ 0.59 $ 0.60
DIVIDENDS DECLARED PER COMMON SHARE (2) $ 0.31 $ 0.31 $ 0.28 $ 0.28 $ 0.28 $ — $ 0.54 $ 0.26
DIVIDENDS PAID PER COMMON SHARE $ 0.31 $ 0.31 $ 0.28 $ 0.28 $ 0.28 $ 0.28 $ 0.26 $ 0.26
Average common shares outstanding 3,327.6 3,339.6 3,351.2 3,376.0 3,379.4 3,371.9 3,363.8 3,358.3
Diluted average common shares outstanding 3,352.2 3,374.0 3,389.3 3,416.1 3,424.0 3,416.0 3,404.4 3,395.7
Market price per common share (3)
High $ 37.78 $ 37.99 $ 36.49 $ 36.64 $ 36.99 $ 36.89 $ 34.86 $ 32.76
Low 29.29 32.66 33.93 33.01 34.90 33.36 31.90 30.31
Quarter end 30.19 35.62 35.17 34.43 35.56 36.18 33.54 31.94
(1) Results for third quarter 2007 and second quarter 2006 have been revised to reflect $170 million and $95 million, respectively, of litigation expenses associated with
indemnification obligations arising from the Company’s ownership interest in Visa.
(2) On April 25, 2006, the Company’s Board of Directors declared the second quarter 2006 cash dividend payable June 1, 2006. On June 27, 2006, the Board declared a two-for-one
split in the form of a 100% stock dividend on the Company’s common stock and, at the same time, the third quarter 2006 cash dividend payable September 1, 2006.
(3) Based on daily prices reported on the New York Stock Exchange Composite Transaction Reporting System.
130