Wells Fargo 2007 Annual Report Download - page 77
Download and view the complete annual report
Please find page 77 of the 2007 Wells Fargo annual report below. You can navigate through the pages in the report by either clicking on the pages listed below, or by using the keyword search tool below to find specific information within the annual report.-
 1
1 -
2
-
3
-
4
-
5
-
6
-
7
-
8
-
9
-
10
-
11
-
12
-
13
-
14
-
15
-
16
-
17
-
18
-
19
-
20
-
21
-
22
-
23
-
24
-
25
-
26
-
27
-
28
-
29
-
30
-
31
-
32
-
33
-
34
-
35
-
36
-
37
-
38
-
39
-
40
-
41
-
42
-
43
-
44
-
45
-
46
-
47
-
48
-
49
-
50
-
51
-
52
-
53
-
54
-
55
-
56
-
57
-
58
-
59
-
60
-
61
-
62
-
63
-
64
-
65
-
66
-
 67
67 -
 68
68 -
 69
69 -
 70
70 -
 71
71 -
 72
72 -
 73
73 -
 74
74 -
 75
75 -
 76
76 -
 77
77 -
 78
78 -
 79
79 -
 80
80 -
 81
81 -
 82
82 -
 83
83 -
 84
84 -
 85
85 -
 86
86 -
 87
87 -
88
-
89
-
90
-
91
-
92
-
93
-
94
-
95
-
96
-
97
-
98
-
99
-
100
-
101
-
102
-
103
-
104
-
105
-
106
-
107
-
108
-
109
-
110
-
111
-
112
-
113
-
114
-
115
-
116
-
117
-
118
-
119
-
120
-
121
-
122
-
123
-
124
-
125
-
126
-
127
-
128
-
129
-
130
-
131
-
132
-
133
-
134
-
135
-
136
 |
 |

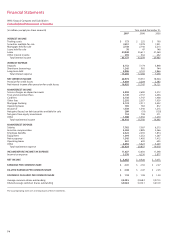
74
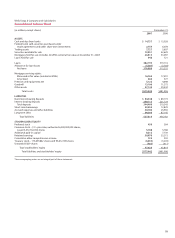
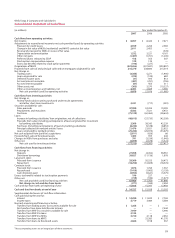
Wells Fargo & Company and Subsidiaries
Consolidated Statement of Income
(in millions, except per share amounts) Year ended December 31,
2007 2006 2005
INTEREST INCOME
Trading assets $ 173 $ 225 $ 190
Securities available for sale 3,451 3,278 1,921
Mortgages held for sale 2,150 2,746 2,213
Loans held for sale 70 47 146
Loans 29,040 25,611 21,260
Other interest income 293 332 232
Total interest income 35,177 32,239 25,962
INTEREST EXPENSE
Deposits 8,152 7,174 3,848
Short-term borrowings 1,245 992 744
Long-term debt 4,806 4,122 2,866
Total interest expense 14,203 12,288 7,458
NET INTEREST INCOME 20,974 19,951 18,504
Provision for credit losses 4,939 2,204 2,383
Net interest income after provision for credit losses 16,035 17,747 16,121
NONINTEREST INCOME
Service charges on deposit accounts 3,050 2,690 2,512
Trust and investment fees 3,149 2,737 2,436
Card fees 2,136 1,747 1,458
Other fees 2,292 2,057 1,929
Mortgage banking 3,133 2,311 2,422
Operating leases 703 783 812
Insurance 1,530 1,340 1,215
Net gains (losses) on debt securities available for sale 209 (19) (120)
Net gains from equity investments 734 738 511
Other 1,480 1,356 1,270
Total noninterest income 18,416 15,740 14,445
NONINTEREST EXPENSE
Salaries 7,762 7,007 6,215
Incentive compensation 3,284 2,885 2,366
Employee benefits 2,322 2,035 1,874
Equipment 1,294 1,252 1,267
Net occupancy 1,545 1,405 1,412
Operating leases 561 630 635
Other 6,056 5,623 5,249
Total noninterest expense 22,824 20,837 19,018
INCOME BEFORE INCOME TAX EXPENSE 11,627 12,650 11,548
Income tax expense 3,570 4,230 3,877
NET INCOME $ 8,057 $ 8,420 $ 7,671
EARNINGS PER COMMON SHARE $2.41 $ 2.50 $ 2.27
DILUTED EARNINGS PER COMMON SHARE $ 2.38 $ 2.47 $ 2.25
DIVIDENDS DECLARED PER COMMON SHARE $ 1.18 $ 1.08 $ 1.00
Average common shares outstanding 3,348.5 3,368.3 3,372.5
Diluted average common shares outstanding 3,382.8 3,410.1 3,410.9
The accompanying notes are an integral part of these statements.
Financial Statements