Wells Fargo 2007 Annual Report Download - page 135
Download and view the complete annual report
Please find page 135 of the 2007 Wells Fargo annual report below. You can navigate through the pages in the report by either clicking on the pages listed below, or by using the keyword search tool below to find specific information within the annual report.-
 1
1 -
2
-
3
-
4
-
5
-
6
-
7
-
8
-
9
-
10
-
11
-
12
-
13
-
14
-
15
-
16
-
17
-
18
-
19
-
20
-
21
-
22
-
23
-
24
-
25
-
26
-
27
-
28
-
29
-
30
-
31
-
32
-
33
-
34
-
35
-
36
-
37
-
38
-
39
-
40
-
41
-
42
-
43
-
44
-
45
-
46
-
47
-
48
-
49
-
50
-
51
-
52
-
53
-
54
-
55
-
56
-
57
-
58
-
59
-
60
-
61
-
62
-
63
-
64
-
65
-
66
-
67
-
68
-
69
-
70
-
71
-
72
-
73
-
74
-
75
-
76
-
77
-
78
-
79
-
80
-
81
-
82
-
83
-
84
-
85
-
86
-
87
-
88
-
89
-
90
-
91
-
92
-
93
-
94
-
95
-
96
-
97
-
98
-
99
-
100
-
101
-
102
-
103
-
104
-
105
-
106
-
107
-
108
-
109
-
110
-
111
-
112
-
113
-
114
-
115
-
116
-
117
-
118
-
119
-
120
-
121
-
122
-
123
-
124
-
 125
125 -
 126
126 -
 127
127 -
 128
128 -
 129
129 -
 130
130 -
 131
131 -
 132
132 -
 133
133 -
 134
134 -
 135
135 -
 136
136
 |
 |

132
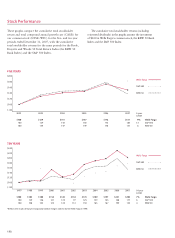
Stock Performance
These graphs compare the cumulative total stockholder
return and total compound annual growth rate (CAGR) for
our common stock (NYSE: WFC) for the five- and ten-year
periods ended December 31, 2007, with the cumulative
total stockholder returns for the same periods for the Keefe,
Bruyette and Woods 50 Total Return Index (the KBW 50
Bank Index) and the S&P 500 Index.
The cumulative total stockholder returns (including
reinvested dividends) in the graphs assume the investment
of $100 in Wells Fargo’s common stock, the KBW 50 Bank
Index and the S&P 500 Index.
$200
$180
$160
$140
$120
$100
$80
2002
$100
100
100
2003
$129
129
134
2004
$141
143
147
2005
$147
150
149
2006
$172
173
178
2007
$151
183
137
1997*
$100
100
100
1998
$105
129
108
1999
$108
156
105
2000
$153
141
125
2001
$122
125
120
2002
$134
97
112
2003
$174
125
150
2004
$189
139
165
2005
$197
145
167
2006
$231
168
199
2007
$203
177
153
5-year
CAGR
9% Wells Fargo
13 S&P 500
6 KBW 50
FIVE YEARS
10-year
CAGR
7% Wells Fargo
6 S&P 500
4KBW 50
Wells Fargo
S&P 500
KBW 50
*Reflects the results of Norwest Corporation before merger with the former Wells Fargo in 1998.
$240
$220
$200
$180
$160
$140
$120
$100
$80
TEN YEARS
Wells Fargo
S&P 500
KBW 50