Wells Fargo 2007 Annual Report Download - page 98
Download and view the complete annual report
Please find page 98 of the 2007 Wells Fargo annual report below. You can navigate through the pages in the report by either clicking on the pages listed below, or by using the keyword search tool below to find specific information within the annual report.-
 1
1 -
2
-
3
-
4
-
5
-
6
-
7
-
8
-
9
-
10
-
11
-
12
-
13
-
14
-
15
-
16
-
17
-
18
-
19
-
20
-
21
-
22
-
23
-
24
-
25
-
26
-
27
-
28
-
29
-
30
-
31
-
32
-
33
-
34
-
35
-
36
-
37
-
38
-
39
-
40
-
41
-
42
-
43
-
44
-
45
-
46
-
47
-
48
-
49
-
50
-
51
-
52
-
53
-
54
-
55
-
56
-
57
-
58
-
59
-
60
-
61
-
62
-
63
-
64
-
65
-
66
-
67
-
68
-
69
-
70
-
71
-
72
-
73
-
74
-
75
-
76
-
77
-
78
-
79
-
80
-
81
-
82
-
83
-
84
-
85
-
86
-
87
-
 88
88 -
 89
89 -
 90
90 -
 91
91 -
 92
92 -
 93
93 -
 94
94 -
 95
95 -
 96
96 -
 97
97 -
 98
98 -
 99
99 -
 100
100 -
 101
101 -
 102
102 -
 103
103 -
 104
104 -
 105
105 -
 106
106 -
 107
107 -
 108
108 -
109
-
110
-
111
-
112
-
113
-
114
-
115
-
116
-
117
-
118
-
119
-
120
-
121
-
122
-
123
-
124
-
125
-
126
-
127
-
128
-
129
-
130
-
131
-
132
-
133
-
134
-
135
-
136
 |
 |

95
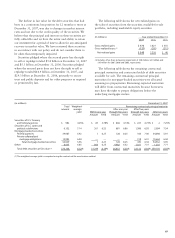
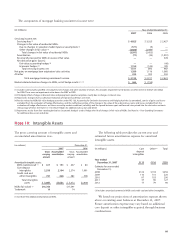
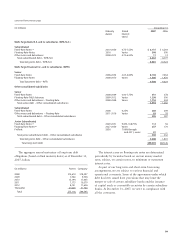
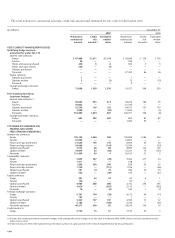
(in millions) Year ended December 31,
2007 2006 2005
Servicing income, net:
Servicing fees (1) $ 4,025 $ 3,525 $ 2,457
Changes in fair value of residential MSRs:
Due to changes in valuation model inputs or assumptions (2) (571) (9) —
Other changes in fair value (3) (3,026) (2,444) —
Total changes in fair value of residential MSRs (3,597) (2,453) —
Amortization (71) (34) (1,991)
Reversal of provision for MSRs in excess of fair value —— 378
Net derivative gains (losses):
Fair value accounting hedges (4) —— (46)
Economic hedges (5) 1,154 (145) 189
Total servicing income, net 1,511 893 987
Net gains on mortgage loan origination/sales activities 1,289 1,116 1,085
All other 333 302 350
Total mortgage banking noninterest income $ 3,133 $ 2,311 $ 2,422
Market-related valuation changes to MSRs, net of hedge results (2) + (5) $ 583 $ (154)
(1) Includes contractually specified servicing fees, late charges and other ancillary revenues. Also includes impairment write-downs on other interests held of $26 million
for 2006. There were no impairment write-downs for 2007 or 2005.
(2) Principally reflects changes in discount rates and prepayment speed assumptions, mostly due to changes in interest rates.
(3) Represents changes due to collection/realization of expected cash flows over time.
(4) Results related to MSRs fair value hedging activities under FAS 133, Accounting for Derivative Instruments and Hedging Activities (as amended), consist of gains and losses
excluded from the evaluation of hedge effectiveness and the ineffective portion of the change in the value of these derivatives. Gains and losses excluded from the
evaluation of hedge effectiveness are those caused by market conditions (volatility) and the spread between spot and forward rates priced into the derivative contracts
(the passage of time). See Note 16 – Fair Value Hedges for additional discussion and detail.
(5) Represents results from free-standing derivatives (economic hedges) used to hedge the risk of changes in fair value of MSRs. See Note 16 – Free-Standing Derivatives
for additional discussion and detail.
The components of mortgage banking noninterest income were:
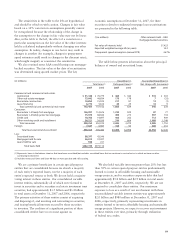
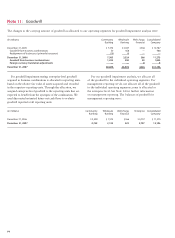
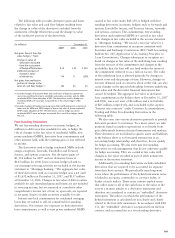
The gross carrying amount of intangible assets and
accumulated amortization was:
Note 10: Intangible Assets
We based our projections of amortization expense shown
above on existing asset balances at December 31, 2007.
Future amortization expense may vary based on additional
core deposit or other intangibles acquired through business
combinations.
(in millions) December 31,
2007 2006
Gross Accumulated Gross Accumulated
carrying amortization carrying amortization
amount amount
Amortized intangible assets:
MSRs (commercial) (1) $ 617 $ 151 $ 457 $ 80
Core deposit
intangibles 2,539 2,104 2,374 1,991
Credit card and
other intangibles 731 426 581 378
Total intangible
assets $ 3,887 $2,681 $ 3,412 $2,449
MSRs (fair value) (1) $16,763 $17,591
Trademark 14 14
(1) See Note 9 for additional information on MSRs.
(in millions) Core Other(1) Total
deposit
intangibles
Year ended
December 31, 2007 $113 $116 $229
Estimate for year ended
December 31,
2008 $122 $134 $256
2009 110 116 226
2010 97 103 200
2011 37 90 127
2012 17 79 96
(1) Includes amortized commercial MSRs and credit card and other intangibles.
The following table provides the current year and
estimated future amortization expense for amortized
intangible assets.