Wells Fargo 2007 Annual Report Download - page 53
Download and view the complete annual report
Please find page 53 of the 2007 Wells Fargo annual report below. You can navigate through the pages in the report by either clicking on the pages listed below, or by using the keyword search tool below to find specific information within the annual report.-
 1
1 -
2
-
3
-
4
-
5
-
6
-
7
-
8
-
9
-
10
-
11
-
12
-
13
-
14
-
15
-
16
-
17
-
18
-
19
-
20
-
21
-
22
-
23
-
24
-
25
-
26
-
27
-
28
-
29
-
30
-
31
-
32
-
33
-
34
-
35
-
36
-
37
-
38
-
39
-
40
-
41
-
42
-
 43
43 -
 44
44 -
 45
45 -
 46
46 -
 47
47 -
 48
48 -
 49
49 -
 50
50 -
 51
51 -
 52
52 -
 53
53 -
 54
54 -
 55
55 -
 56
56 -
 57
57 -
 58
58 -
 59
59 -
 60
60 -
 61
61 -
 62
62 -
 63
63 -
64
-
65
-
66
-
67
-
68
-
69
-
70
-
71
-
72
-
73
-
74
-
75
-
76
-
77
-
78
-
79
-
80
-
81
-
82
-
83
-
84
-
85
-
86
-
87
-
88
-
89
-
90
-
91
-
92
-
93
-
94
-
95
-
96
-
97
-
98
-
99
-
100
-
101
-
102
-
103
-
104
-
105
-
106
-
107
-
108
-
109
-
110
-
111
-
112
-
113
-
114
-
115
-
116
-
117
-
118
-
119
-
120
-
121
-
122
-
123
-
124
-
125
-
126
-
127
-
128
-
129
-
130
-
131
-
132
-
133
-
134
-
135
-
136
 |
 |

50
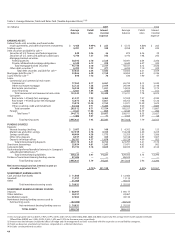
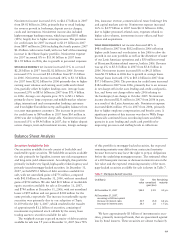
Table 9: Deposits
(in millions) December 31,%
2007 2006 Change
Noninterest-bearing $ 84,348 $ 89,119 (5)%
Interest-bearing checking 5,277 3,540 49
Market rate and
other savings 153,924 140,283 10
Savings certificates 42,708 37,282 15
Foreign deposits (1) 25,474 17,844 43
Core deposits 311,731 288,068 8
Other time deposits 3,654 13,819 (74)
Other foreign deposits 29,075 8,356 248
Total deposits $344,460 $310,243 11
(1) Reflects Eurodollar sweep balances included in core deposits.
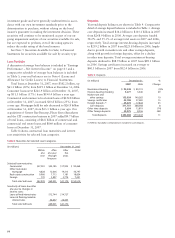
Table 8: Maturities for Selected Loan Categories
(in millions) December 31, 2007
Within After After Total
one one year five
year through years
five years
Selected loan maturities:
Commercial $27,381 $45,185 $17,902 $ 90,468
Other real estate
mortgage 4,828 12,606 19,313 36,747
Real estate construction 9,960 7,713 1,181 18,854
Foreign 770 3,897 2,774 7,441
Total selected loans $42,939 $69,401 $41,170 $153,510
Sensitivity of loans due after
one year to changes in
interest rates:
Loans at fixed interest rates $12,744 $14,727
Loans at floating/variable
interest rates 56,657 26,443
Total selected loans $69,401 $41,170
investment grade and were generally underwritten in accor-
dance with our own investment standards prior to the
determination to purchase, without relying on the bond
insurer’s guarantee in making the investment decision. These
securities will continue to be monitored as part of our on-
going impairment analysis of our securities available for sale,
but are expected to perform, even if the rating agencies
reduce the credit rating of the bond insurers.
See Note 5 (Securities Available for Sale) to Financial
Statements for securities available for sale by security type.
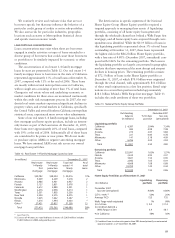
Loan Portfolio
A discussion of average loan balances is included in “Earnings
Performance – Net Interest Income” on page 43 and a
comparative schedule of average loan balances is included
in Table 3; year-end balances are in Note 6 (Loans and
Allowance for Credit Losses) to Financial Statements.
Total loans at December 31, 2007, were $382.2 billion, up
$63.1 billion (20%) from $319.1 billion at December 31, 2006.
Consumer loans were $221.9 billion at December 31, 2007,
up $31.5 billion (17%) from $190.4 billion a year ago.
Commercial and commercial real estate loans of $152.8 billion
at December 31, 2007, increased $30.8 billion (25%) from
a year ago. Mortgages held for sale decreased to $26.8 billion
at December 31, 2007, from $33.1 billion a year ago. Our
acquisitions of Greater Bay Bancorp, Placer Sierra Bancshares
and the CIT construction business in 2007 added $9.7 billion
of total loans, consisting of $8.8 billion of commercial and
commercial real estate loans and $866 million of consumer
loans at December 31, 2007.
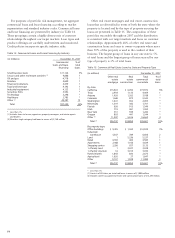
Table 8 shows contractual loan maturities and interest
rate sensitivities for selected loan categories.
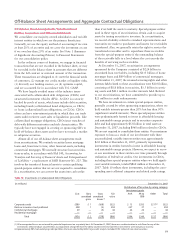
Deposits
Year-end deposit balances are shown in Table 9. Comparative
detail of average deposit balances is included in Table 3. Average
core deposits increased $34.2 billion to $303.1 billion in 2007
from $268.9 billion in 2006. Average core deposits funded
58.2% and 55.3% of average total assets in 2007 and 2006,
respectively. Total average interest-bearing deposits increased
to $239.2 billion in 2007 from $223.8 billion in 2006, largely
due to growth in market rate and other savings deposits,
along with growth in foreign deposits, offset by a decline
in other time deposits. Total average noninterest-bearing
deposits declined to $88.9 billion in 2007 from $89.1 billion
in 2006. Savings certificates increased on average to
$40.5 billion in 2007 from $32.4 billion in 2006.