Volvo 2006 Annual Report Download - page 93
Download and view the complete annual report
Please find page 93 of the 2006 Volvo annual report below. You can navigate through the pages in the report by either clicking on the pages listed below, or by using the keyword search tool below to find specific information within the annual report.-
 1
1 -
2
-
3
-
4
-
5
-
6
-
7
-
8
-
9
-
10
-
11
-
12
-
13
-
14
-
15
-
16
-
17
-
18
-
19
-
20
-
21
-
22
-
23
-
24
-
25
-
26
-
27
-
28
-
29
-
30
-
31
-
32
-
33
-
34
-
35
-
36
-
37
-
38
-
39
-
40
-
41
-
42
-
43
-
44
-
45
-
46
-
47
-
48
-
49
-
50
-
51
-
52
-
53
-
54
-
55
-
56
-
57
-
58
-
59
-
60
-
61
-
62
-
63
-
64
-
65
-
66
-
67
-
68
-
69
-
70
-
71
-
72
-
73
-
74
-
75
-
76
-
77
-
78
-
79
-
80
-
81
-
82
-
 83
83 -
 84
84 -
 85
85 -
 86
86 -
 87
87 -
 88
88 -
 89
89 -
 90
90 -
 91
91 -
 92
92 -
 93
93 -
 94
94 -
 95
95 -
 96
96 -
 97
97 -
 98
98 -
 99
99 -
 100
100 -
 101
101 -
 102
102 -
 103
103 -
104
-
105
-
106
-
107
-
108
-
109
-
110
-
111
-
112
-
113
-
114
-
115
-
116
-
117
-
118
-
119
-
120
-
121
-
122
-
123
-
124
-
125
-
126
-
127
-
128
-
129
-
130
-
131
-
132
-
133
-
134
-
135
-
136
-
137
-
138
-
139
-
140
-
141
-
142
-
143
-
144
-
145
-
146
-
147
-
148
-
149
-
150
-
151
-
152
-
153
-
154
-
155
-
156
-
157
-
158
-
159
-
160
-
161
-
162
-
163
-
164
-
165
-
166
-
167
-
168
-
169
-
170
 |
 |

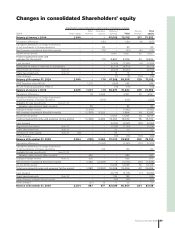
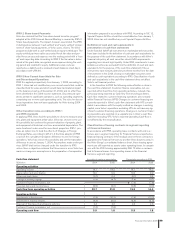
Changes in consolidated Shareholders’ equity
Shareholders’ equity attributable to equity holders of the parent company
Other Translation Retained Minority Total
SEK M Share capital reserves reserve earnings Total interests equity
Balance at January 1, 2004 2,649 – – 69,666 72,315 217 72,532
Translation differences – – (151) – (151) (6) (157)
Translation differences on hedge instruments
of net investments in foreign operations – – 80 – 80 – 80
Net income recognised directly in equity – – (71) – (71) (6) (77)
Income for the period – – – 9,867 9,867 40 9,907
Total recognised income and
expense for the period – – (71) 9,867 9,796 34 9,830
Cash dividend – – – (3,356) (3,356) (9) (3,365)
Distribution of shares in Ainax AB to shareholders – – – (6,310) (6,310) – (6,310)
Repurchase own shares Note 23 – – – (2,532) (2,532) – (2,532)
Share based payments Note 34 – – – 14 14 – 14
Other changes – – – (1) (1) (13) (14)
Balance at December 31, 2004 2,649 – (71) 67,348 69,926 229 70,155
IFRS Transition effect IAS 39 – 1,007 – (659) 348 – 348
IAS 39 Financial guarantees, IFRIC 4 – – – (10) (10) – (10)
Balance at January 1, 2005 2,649 1,007 (71) 66,679 70,264 229 70,493
Translation differences – 24 3,543 – 3,567 24 3,591
Translation differences on hedge instruments
of net investments in foreign operations – – (220) – (220) – (220)
Available-for-sale investments: Note 15, 23
Valuation gains/(losses) taken to equity – 83 – – 83 – 83
Change in hedge reserve – (1,442) – – (1,442) – (1,442)
Net income recognised directly in equity – (1,335) 3,323 – 1,988 24 2,012
Income for the period – – – 13,054 13,054 54 13,108
Total recognised income and expense for the period – (1,335) 3,323 13,054 15,042 78 15,120
Cash dividend – – – (5,055) (5,055) (28) (5,083)
Repurchase own shares Note 23 – – – (1,764) (1,764) – (1,764)
Share based payments Note 34 – – – 23 23 – 23
Decrease of share capital Note 23 (95) – – 95 – – –
Other changes – – – (10) (10) (19) (29)
Balance at December 31, 2005 2,554 (328) 3,252 73,022 78,500 260 78,760
Translation differences – – (2,743) – (2,743) (20) (2,763)
Translation differences on hedge instruments
of net investments in foreign operations – – 149 – 149 – 149
Available-for-sale investments: Note 15, 23
Valuation gains/(losses) taken to equity – 383 – – 383 – 383
Change in hedge reserve Note 23 – 999 – – 999 – 999
Net income recognised directly in equity – 1,382 (2,594) 0 (1,212) (20) (1,232)
Income for the period – – – 16,268 16,268 50 16,318
Total recognised income and expense for the period – 1,382 (2,594) 16,268 15,056 30 15,086
Cash dividend – – – (6,775) (6,775) (7) (6,782)
Share based payments Note 34 – – – 159 159 – 159
Other changes in Nissan Diesel’s equity – – – (65) (65) – (65)
Other changes – (67) 19 77 29 1 30
Balance at December 31, 2006 2,554 987 677 82,686 86,904 284 87,188
Financial information 2006 89