Volvo 2006 Annual Report Download - page 115
Download and view the complete annual report
Please find page 115 of the 2006 Volvo annual report below. You can navigate through the pages in the report by either clicking on the pages listed below, or by using the keyword search tool below to find specific information within the annual report.-
 1
1 -
2
-
3
-
4
-
5
-
6
-
7
-
8
-
9
-
10
-
11
-
12
-
13
-
14
-
15
-
16
-
17
-
18
-
19
-
20
-
21
-
22
-
23
-
24
-
25
-
26
-
27
-
28
-
29
-
30
-
31
-
32
-
33
-
34
-
35
-
36
-
37
-
38
-
39
-
40
-
41
-
42
-
43
-
44
-
45
-
46
-
47
-
48
-
49
-
50
-
51
-
52
-
53
-
54
-
55
-
56
-
57
-
58
-
59
-
60
-
61
-
62
-
63
-
64
-
65
-
66
-
67
-
68
-
69
-
70
-
71
-
72
-
73
-
74
-
75
-
76
-
77
-
78
-
79
-
80
-
81
-
82
-
83
-
84
-
85
-
86
-
87
-
88
-
89
-
90
-
91
-
92
-
93
-
94
-
95
-
96
-
97
-
98
-
99
-
100
-
101
-
102
-
103
-
104
-
 105
105 -
 106
106 -
 107
107 -
 108
108 -
 109
109 -
 110
110 -
 111
111 -
 112
112 -
 113
113 -
 114
114 -
 115
115 -
 116
116 -
 117
117 -
 118
118 -
 119
119 -
 120
120 -
 121
121 -
 122
122 -
 123
123 -
 124
124 -
 125
125 -
126
-
127
-
128
-
129
-
130
-
131
-
132
-
133
-
134
-
135
-
136
-
137
-
138
-
139
-
140
-
141
-
142
-
143
-
144
-
145
-
146
-
147
-
148
-
149
-
150
-
151
-
152
-
153
-
154
-
155
-
156
-
157
-
158
-
159
-
160
-
161
-
162
-
163
-
164
-
165
-
166
-
167
-
168
-
169
-
170
 |
 |
Financial information 2006 111
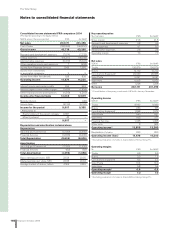
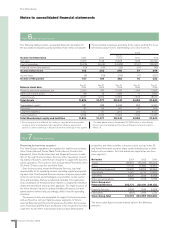
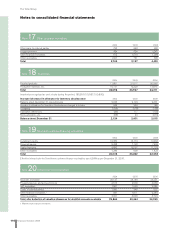
Note 13 Minority interests
Minority interests in income (loss) for the period and in shareholders’ equity consisted mainly of the minority interests in Volvo Aero Norge AS
(22%), in Wuxi da Hao Power Co, Ltd (30%) and in Berliet Maroc S.A (30%).
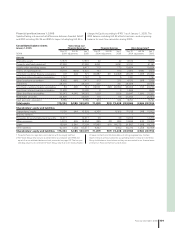
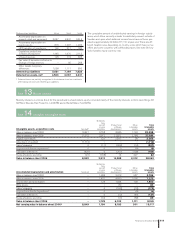
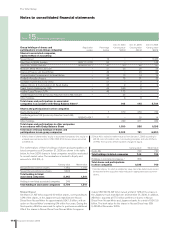
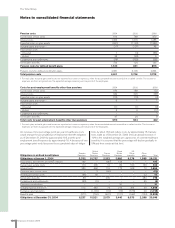
Note 14 Intangible and tangible assets
Entrances
fees,
aircraft Product and Other Total
engine software intangible intangible
Intangible assets, acquisition costs Goodwill1 programs development assets assets
Value in balance sheet 2004 10,321 2,758 8,585 1,734 23,398
Value in balance sheet 2005 11,072 2,971 11,817 1,784 27,644
Capital expenditures – 121 2,917 28 3,066
Adjustment of goodwill (1,712) – – – (1,712)
Sales/scrapping 0 (11) (203) (13) (227)
Acquired and divested operations
3 0 0 0 (6) (6)
Translation differences (420) 0 (257) (108) (785)
Reclassifi cations and other (91) (168) 14 327 82
Value in balance sheet 2006 8,849 2,913 14,288 2,012 28,062
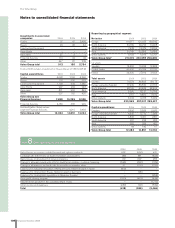
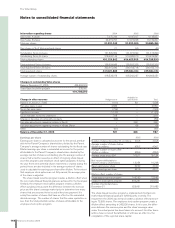
Deferred tax liabilities: 2004 2005 2006
Accelerated depreciation on
property, plant and equipment 2,047 2,347 2,514
Accelerated depreciation on
leasing assets 815 1,297 1,226
LIFO valuation of inventories 160 217 182
Capitalized product and
software development 1,445 1,970 2,113
Untaxed reserves 126 112 635
Fair value of derivative instruments:
Change of hedge reserves – 95 268
Other taxable temporary
differences 1,058 1,111 890
Deferred tax liabilities 5,651 7,149 7,828
Deferred tax assets, net
1 4,563 3,067 2,241
1 Deferred taxes are partially recognized in the balance sheet on a net basis
after taking into account offsetting possibilities.
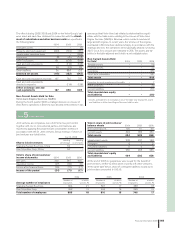
The cumulative amount of undistributed earnings in foreign subsid-
iaries, which Volvo currently intends to indefi nitely reinvest outside of
Sweden and upon which deferred income taxes have not been pro-
vided is approximately 29 billion (17; 12) at year end. There are dif-
ferent taxation rules depending on country, some which have no tax
effect and some countries with withholding taxes. See note 36 how
Volvo handles equity currency risk.
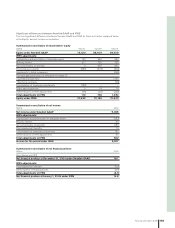
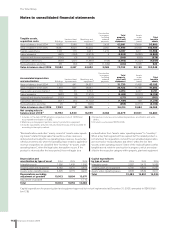
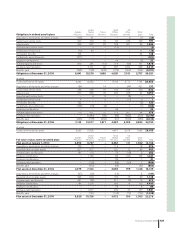
Entrances
fees,
aircraft Product and Other Total
engine software intangible intangible
Accumulated depreciation and amortization Goodwill programs development assets assets
Value in balance sheet 2004 – 1,386 3,413 987 5,786
Value in balance sheet 2005 – 1,437 4,690 1,096 7,223
Depreciation and amortization – 128 1,584 138 1,850
Write-downs – – 80 – 80
Sales/scrapping – 0 (160) (12) (172)
Acquired and divested operations
3 – 0 – (4) (4)
Translation differences – 0 (72) (49) (121)
Reclassifi cations and other – 164 (17) (58) 89
Value in balance sheet 2006 – 1,729 6,105 1,111 8,945
Net carrying value in balance sheet 2006
4 8,849 1,184 8,183 901 19,117