Volvo 2006 Annual Report Download - page 119
Download and view the complete annual report
Please find page 119 of the 2006 Volvo annual report below. You can navigate through the pages in the report by either clicking on the pages listed below, or by using the keyword search tool below to find specific information within the annual report.-
 1
1 -
2
-
3
-
4
-
5
-
6
-
7
-
8
-
9
-
10
-
11
-
12
-
13
-
14
-
15
-
16
-
17
-
18
-
19
-
20
-
21
-
22
-
23
-
24
-
25
-
26
-
27
-
28
-
29
-
30
-
31
-
32
-
33
-
34
-
35
-
36
-
37
-
38
-
39
-
40
-
41
-
42
-
43
-
44
-
45
-
46
-
47
-
48
-
49
-
50
-
51
-
52
-
53
-
54
-
55
-
56
-
57
-
58
-
59
-
60
-
61
-
62
-
63
-
64
-
65
-
66
-
67
-
68
-
69
-
70
-
71
-
72
-
73
-
74
-
75
-
76
-
77
-
78
-
79
-
80
-
81
-
82
-
83
-
84
-
85
-
86
-
87
-
88
-
89
-
90
-
91
-
92
-
93
-
94
-
95
-
96
-
97
-
98
-
99
-
100
-
101
-
102
-
103
-
104
-
105
-
106
-
107
-
108
-
 109
109 -
 110
110 -
 111
111 -
 112
112 -
 113
113 -
 114
114 -
 115
115 -
 116
116 -
 117
117 -
 118
118 -
 119
119 -
 120
120 -
 121
121 -
 122
122 -
 123
123 -
 124
124 -
 125
125 -
 126
126 -
 127
127 -
 128
128 -
 129
129 -
130
-
131
-
132
-
133
-
134
-
135
-
136
-
137
-
138
-
139
-
140
-
141
-
142
-
143
-
144
-
145
-
146
-
147
-
148
-
149
-
150
-
151
-
152
-
153
-
154
-
155
-
156
-
157
-
158
-
159
-
160
-
161
-
162
-
163
-
164
-
165
-
166
-
167
-
168
-
169
-
170
 |
 |
Financial information 2006 115
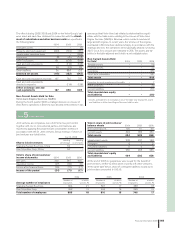
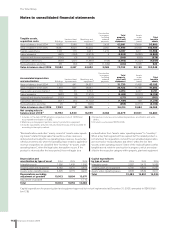
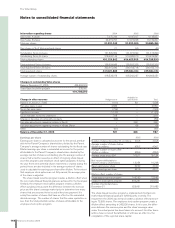
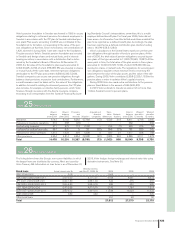
Note 16 Long-term customer-fi nancing receivables
2004 2005 2006
Installment credits 14,726 17,865 17,475
Financial leasing 10,334 12,737 13,980
Other receivables 127 582 634
Total 25,187 31,184 32,089
Effective interest rate for Long-term customer fi n ance receivables was 6.82% as per December 31, 2006.
Long-term customer fi nance receivables maturities
2008 14,205
2009 9,631
2010 5,402
2011 1,944
2012 or later 907
Total 32,089
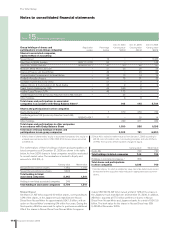
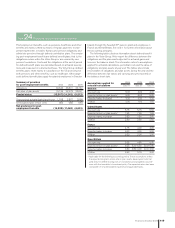
The holding is reported as an associated company, since Volvo
believes that substantial infl uence exists. Executive Vice President
of AB Volvo and Deputy CEO of the Volvo Group, Jorma Halonen,
was appointed Vice Chairman of the Board of Directors of Nissan
Diesel on June 28.
Volvo reports its share in earnings of Nissan Diesel with a time-
lag of one quarter.
Please fi n d further information under Signifi cant events, page 47,
regarding Volvo making a public offer for Nissan Diesel.
Deutz
During 2006 Volvo has invested additionaly 95 in Deutz AG.
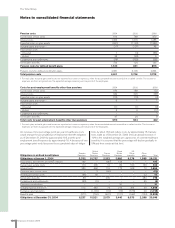
Peach County Holdings Inc
In 2004, as a part of the restructuring of Henlys Group Plc, see
note 11, the convertible debenture loan issued to Henlys was partly
converted into shares in Peach County Holdings (owner of school
bus manufacturer Blue Bird). Volvo’s holding in Peach County Hold-
ings Inc was 42,5%. During the fourth quarter of 2005 Volvo wrote
down its shareholding in Peach County Holdings, Inc. by about 550.
At December 31, 2005 Volvo held 42.5% of the US-based company.
Since its reconstruction in the preceding year, Blue Bird has not
developed well. The write-down was made as a consequence of
Volvo’s decision not to participate in continued fi nancing efforts.
After the write-down, the value is zero. In January 2006, Peach
County Holdings entered into reconstruction proceedings (Chapter
11) and as a consequence of Volvo choosing not to participate in the
continued reconstruction, Volvo’s shares in the company were can-
celled.
Småföretagarinvest AB (previously Arbustum Invest AB)
In 2005, Volvo’s holding in Småföretagarinvest AB decreased to
17% and the company is no longer considered as an associated
company.
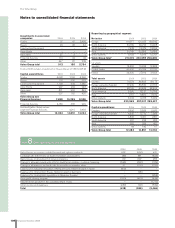
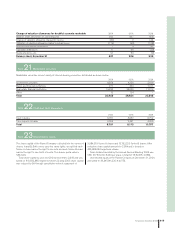
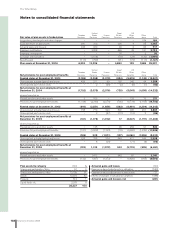
Changes in the Volvo Group’s holdings of shares and participations: 2004 2005 2006
Balance sheet, December 31, preceding year 22,206 2,003 751
IFRS transition effect – (494) –
Acquisitions and divestments, net (20,740) (268) 5,809
Net of write-downs/revaluations 772 (552) (72)
New issue of shares and shareholders’ contributions 45 28 45
Share of income in associated companies 29 (80) 55
Change in Group structure (280) (90) 0
Fair value of shares – 83 392
Translation differences (29) 159 (30)
Dividends 0 (2) (3)
Other 0 (36) (57)
Balance sheet, December 31 2,003 751 6,890