Volvo 2006 Annual Report Download - page 71
Download and view the complete annual report
Please find page 71 of the 2006 Volvo annual report below. You can navigate through the pages in the report by either clicking on the pages listed below, or by using the keyword search tool below to find specific information within the annual report.-
 1
1 -
2
-
3
-
4
-
5
-
6
-
7
-
8
-
9
-
10
-
11
-
12
-
13
-
14
-
15
-
16
-
17
-
18
-
19
-
20
-
21
-
22
-
23
-
24
-
25
-
26
-
27
-
28
-
29
-
30
-
31
-
32
-
33
-
34
-
35
-
36
-
37
-
38
-
39
-
40
-
41
-
42
-
43
-
44
-
45
-
46
-
47
-
48
-
49
-
50
-
51
-
52
-
53
-
54
-
55
-
56
-
57
-
58
-
59
-
60
-
 61
61 -
 62
62 -
 63
63 -
 64
64 -
 65
65 -
 66
66 -
 67
67 -
 68
68 -
 69
69 -
 70
70 -
 71
71 -
 72
72 -
 73
73 -
 74
74 -
 75
75 -
 76
76 -
 77
77 -
 78
78 -
 79
79 -
 80
80 -
 81
81 -
82
-
83
-
84
-
85
-
86
-
87
-
88
-
89
-
90
-
91
-
92
-
93
-
94
-
95
-
96
-
97
-
98
-
99
-
100
-
101
-
102
-
103
-
104
-
105
-
106
-
107
-
108
-
109
-
110
-
111
-
112
-
113
-
114
-
115
-
116
-
117
-
118
-
119
-
120
-
121
-
122
-
123
-
124
-
125
-
126
-
127
-
128
-
129
-
130
-
131
-
132
-
133
-
134
-
135
-
136
-
137
-
138
-
139
-
140
-
141
-
142
-
143
-
144
-
145
-
146
-
147
-
148
-
149
-
150
-
151
-
152
-
153
-
154
-
155
-
156
-
157
-
158
-
159
-
160
-
161
-
162
-
163
-
164
-
165
-
166
-
167
-
168
-
169
-
170
 |
 |

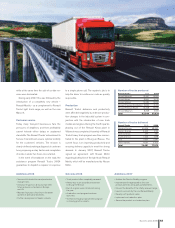
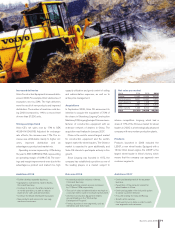
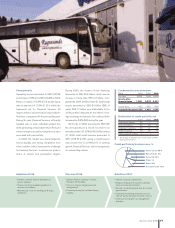
Net sales per market
2004 2005 2006
Europe 77,431 79,706 88,323
North America 35,154 46,129 50,605
South America 5,223 7,657 9,213
Asia 12,378 13,551 8,975
Other markets 6,693 8,353 9,190
Total 136,879 155,396 166,306
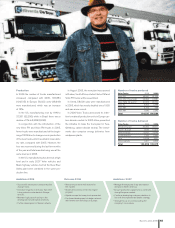
Market shares in Europe1Market shares in North America1
Volvo
Trucks Renault
Trucks
05 060605
14.3% 14.2% 10.6%
10.7%
Volvo
Trucks Mack
Trucks
9.9% 10.2% 9.2%
9.6%
05 060605
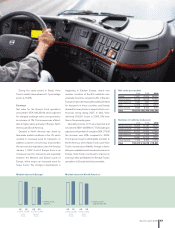
Number of vehicles delivered
2004 2005 2006
Western Europe 90,746 91,087 97,074
Eastern Europe 11,920 12,535 17,343
North America 49,273 64,974 70,499
South America 9,190 11,248 11,646
Asia 24,881 25,706 12,817
Other markets 7,209 8,829 10,552
Total 193,219 214,379 219,931
1 In heavy trucks
segment (class 8).
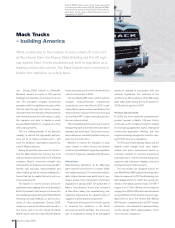
During the same period in Brazil, Volvo
Trucks’ market share advanced 1.7 percentage
points to 15.3%.
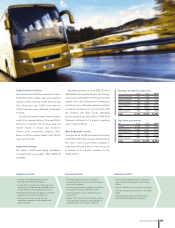
Earnings
Net sales for the Group’s truck operations
amounted to SEK 166,306 M, which adjusted
for changed exchange rates corresponded to
an increase of 7%. The increase was attribut-
able to higher sales, primarily in Europe, North
America and South America.
Demand in North America was driven by
favourable market conditions in the US, which
resulted in increased need for transports. In
addition customers chose to buy trucks before
the new emission legislation came into force by
January 1, 2007. In all of Europe there is an
increased need for transports and especially
between the Western and Eastern parts of
Europe, which means an increased need for
heavy trucks. The strongest development is
happening in Eastern Europe, where new
member countries of the EU contribute sub-
stantially. Countries outside the EU in Eastern
Europe are also developing favourably. Demand
for transports in these countries, and thereby
demand for heavy trucks, is expected to be con-
tinuously strong during 2007. In total, Volvo
delivered 219,931 trucks in 2006, 3% more
than in the preceding year.
Operating income for Trucks improved and
amounted to SEK 14,369 M (11,717). Excluding an
adjustment of goodwill of a negative SEK 1,712 M
the increase was 23% compared to 2005.
The improved result is attributable primarily to
North America, where Mack Trucks and Volvo
Trucks increased profitability through a favor-
able price realization and increased volumes. In
Europe, Volvo Trucks continued to improve its
earnings while profitability for Renault Trucks’
operations in Europe declined somewhat.
1 In heavy trucks
segment.
Business areas 2006 67