Volvo 2006 Annual Report Download - page 128
Download and view the complete annual report
Please find page 128 of the 2006 Volvo annual report below. You can navigate through the pages in the report by either clicking on the pages listed below, or by using the keyword search tool below to find specific information within the annual report.-
 1
1 -
2
-
3
-
4
-
5
-
6
-
7
-
8
-
9
-
10
-
11
-
12
-
13
-
14
-
15
-
16
-
17
-
18
-
19
-
20
-
21
-
22
-
23
-
24
-
25
-
26
-
27
-
28
-
29
-
30
-
31
-
32
-
33
-
34
-
35
-
36
-
37
-
38
-
39
-
40
-
41
-
42
-
43
-
44
-
45
-
46
-
47
-
48
-
49
-
50
-
51
-
52
-
53
-
54
-
55
-
56
-
57
-
58
-
59
-
60
-
61
-
62
-
63
-
64
-
65
-
66
-
67
-
68
-
69
-
70
-
71
-
72
-
73
-
74
-
75
-
76
-
77
-
78
-
79
-
80
-
81
-
82
-
83
-
84
-
85
-
86
-
87
-
88
-
89
-
90
-
91
-
92
-
93
-
94
-
95
-
96
-
97
-
98
-
99
-
100
-
101
-
102
-
103
-
104
-
105
-
106
-
107
-
108
-
109
-
110
-
111
-
112
-
113
-
114
-
115
-
116
-
117
-
 118
118 -
 119
119 -
 120
120 -
 121
121 -
 122
122 -
 123
123 -
 124
124 -
 125
125 -
 126
126 -
 127
127 -
 128
128 -
 129
129 -
 130
130 -
 131
131 -
 132
132 -
 133
133 -
 134
134 -
 135
135 -
 136
136 -
 137
137 -
 138
138 -
139
-
140
-
141
-
142
-
143
-
144
-
145
-
146
-
147
-
148
-
149
-
150
-
151
-
152
-
153
-
154
-
155
-
156
-
157
-
158
-
159
-
160
-
161
-
162
-
163
-
164
-
165
-
166
-
167
-
168
-
169
-
170
 |
 |

124 Financial information 2006
The Volvo Group
Notes to consolidated financial statements
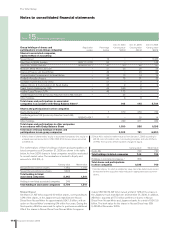
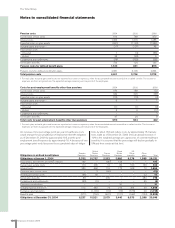
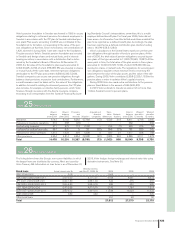
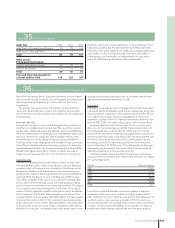
Balance sheet amounts for Other current liabilities were as follows:
2004 2005 2006
Advances from customers 2,298 2,460 2,538
Wages, salaries and withholding
taxes 4,987 5,680 5,745
VAT liabilities 1,193 1,351 1,292
Accrued expenses and
prepaid income 9,094 11,201 10,929
Deferred leasing income 1,141 1,406 1,546
Residual value liability 1,873 1,840 1,594
Other fi nancial liabilities 642 1,762 814
Other liabilities 3,863 4,562 3,253
Total 25,091 30,262 27,711
Secured bank loans at year-end 2006 amounted to 157 (186; 194).
The corresponding amount for other current liabilities was 1,294
(1,685; 1,578).
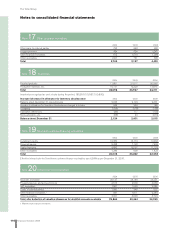
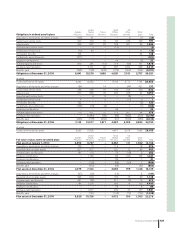
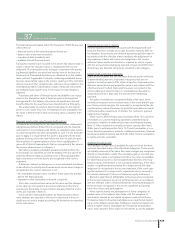
Note 27 Current liabilities
Balance sheet amounts for loans were as follows:
2004 2005 2006
Bank loans 4,267 5,204 4,475
Other loans
1
17,129 26,126 23,772
Total 21,396 31,330 28,247
1 Whereof fi nancial derivatives 147 (1,009; 612).
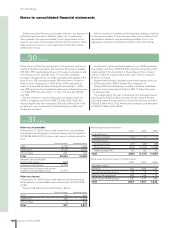
Bank loans include current maturities, 1,442 (2,243; 2,259), of long-
term loans. Other loans include current maturities of long-term loans,
18,967 (18,983; 13,324), and commercial paper, 4,043 (5,413;
2,667).
Non-interest-bearing liabilities accounted for 67,591 (67,681;
57,657), or 70% (68; 73) of the Group’s total current liabilities.
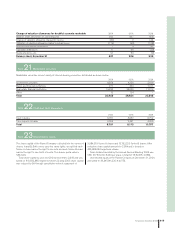
Long-term loans mature as follows:
2008 18,303
2009 8,980
2010 5,604
2011 4,470
2012 628
2013 or later 724
Total 38,709
Of other long-term liabilities the majority will mature within fi v e years.
At year-end 2006, credit facilities granted but not utilized and
which can be used without restrictions amounted to approximately
SEK 23,2 billion (20,9; 19,1). Approximately SEK 22,8 billion of
these facilities consisted of stand-by facilities for loans with varying
maturities through the year 2013. A fee is normally charged for the
unused portion of credit facilities and is reported in the income
statement under other fi n ancial income and expenses.
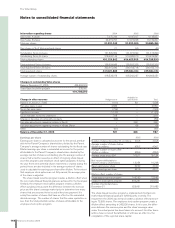
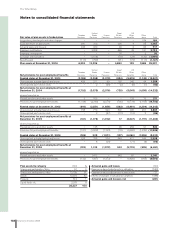
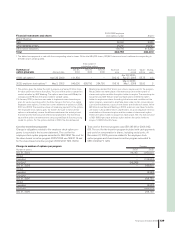
Actual interest rate, Effective interest,
Other loans day of closing, % rate, Dec 31, 2006, % 2004 2005 2006
USD 1999–2005/2008–2011 4.07–5.75 4.98–5.23 5,360 6,193 4,466
EUR 2003–2006/2008–2010 3.85–3.99 3.98–4.00 2,596 2,735 3,238
GBP 2005–2006/2008–2010 5.62–5.67 5.43–5.47 1,269 1,859 1,048
CAD 2002–2006/2008–2012 4.58–5.03 4.11–4.16 1,557 1,950 2,281
MXN 2005/2010 7.54–7.91 7.37–7.38 – 835 693
JPY 2006/2013 0.80 1.54 – – 654
CHF 2006/2009–2011 2.22–2.24 2.63–2.80 – – 1,127
Other loans 2.80-15.69 2,017 2,413 2,023
Total other long-term loans
1 12,799 15,985 15,530
Deferred leasing income 1,377 1,689 2,201
Residual value liability 3,122 2,931 4,187
Other long-term fi nancial liabilities - 476 123
Other long-term liabilities 154 243 237
Total 45,064 48,894 45,457
1 Whereof fi nancial derivatives 93 (394; 243).
Of the above long-term loans, 657 (1,501; 1,422) was secured.