Volvo 2006 Annual Report Download - page 55
Download and view the complete annual report
Please find page 55 of the 2006 Volvo annual report below. You can navigate through the pages in the report by either clicking on the pages listed below, or by using the keyword search tool below to find specific information within the annual report.-
 1
1 -
2
-
3
-
4
-
5
-
6
-
7
-
8
-
9
-
10
-
11
-
12
-
13
-
14
-
15
-
16
-
17
-
18
-
19
-
20
-
21
-
22
-
23
-
24
-
25
-
26
-
27
-
28
-
29
-
30
-
31
-
32
-
33
-
34
-
35
-
36
-
37
-
38
-
39
-
40
-
41
-
42
-
43
-
44
-
 45
45 -
 46
46 -
 47
47 -
 48
48 -
 49
49 -
 50
50 -
 51
51 -
 52
52 -
 53
53 -
 54
54 -
 55
55 -
 56
56 -
 57
57 -
 58
58 -
 59
59 -
 60
60 -
 61
61 -
 62
62 -
 63
63 -
 64
64 -
 65
65 -
66
-
67
-
68
-
69
-
70
-
71
-
72
-
73
-
74
-
75
-
76
-
77
-
78
-
79
-
80
-
81
-
82
-
83
-
84
-
85
-
86
-
87
-
88
-
89
-
90
-
91
-
92
-
93
-
94
-
95
-
96
-
97
-
98
-
99
-
100
-
101
-
102
-
103
-
104
-
105
-
106
-
107
-
108
-
109
-
110
-
111
-
112
-
113
-
114
-
115
-
116
-
117
-
118
-
119
-
120
-
121
-
122
-
123
-
124
-
125
-
126
-
127
-
128
-
129
-
130
-
131
-
132
-
133
-
134
-
135
-
136
-
137
-
138
-
139
-
140
-
141
-
142
-
143
-
144
-
145
-
146
-
147
-
148
-
149
-
150
-
151
-
152
-
153
-
154
-
155
-
156
-
157
-
158
-
159
-
160
-
161
-
162
-
163
-
164
-
165
-
166
-
167
-
168
-
169
-
170
 |
 |

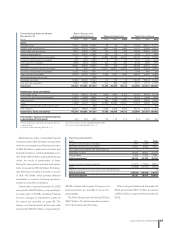
Consolidated income statements 1
SEK M 2004 2005 2006
Net sales 202,171 231,191 248,135
Cost of sales (158,453) (180,823) (192,242)
Gross income 43,718 50,368 55,893
Research and development expenses (7,614) (7,557) (8,354)
Selling expenses (18,317) (19,616) (19,999)
Administrative expenses (5,310) (6,147) (6,352)
Other operating income and expenses 7 (397) (3,292)
Income from Financial Services
1 1,365 2,033 2,301
Income from investments in associated companies 2 (568) 61
Income from other investments 828 37 141
Operating income
2 14,679 18,153 20,399
Interest income and similar credits 993 816 897
Interest expenses and similar charges (1,426) (1,134) (816)
Other financial income and expenses
3 (1,210) 181 (181)
Income after financial items 13,036 18,016 20,299
Income taxes (3,129) (4,908) (3,981)
Income for the period
4 9,907 13,108 16,318
4 Attributable to:
Equity holders of the parent company 9,867 13,054 16,268
Minority 40 54 50
9,907 13,108 16,318
Earnings per share, SEK 23.58 32.22 40.20
1 Financial Services reported in accordance with the equity method.
2 2006 includes an adjustment of goodwill of SEK (1,712) M.
3 2004 includes a write-down relating to the holding in Henlys Group Plc of SEK 1,196 M.
Impact of exchange rates on
operating income
Compared with preceding year, SEK bn
Net sales1 (0.1)
Cost of sales (0.5)
Research and development expenses 0.0
Selling and administrative expenses 0.0
Other operating income and expenses (0.4)
Income from investments in shares 0.0
Total effect of changes in exchange
rates on operating income (1.0)
1 Group sales are reported at average spot rates and
the effects of currency hedges are reported among
”Other operating income and expenses”.
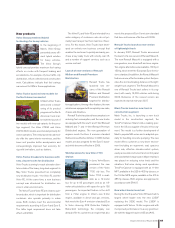
continued to improve its earnings while profit-
ability for Renault Trucks’ operations in Europe
declined somewhat.
Operating income in Buses continued to
improve as a result of the restructuring imple-
mented earlier. Operating income for full-year
2006 was SEK 633 M, an increase of 35%.
Through strong cost control and increased vol-
umes, Volvo Construction Equipment con-
tinued to improve its profitability. Operating
income rose by 41% to SEK 3,888 M in 2006.
Volvo Penta maintained its high profitability
during 2006 and at the same time implemented
aggressive investments in product develop-
ment and substantial marketing efforts to cap-
italize on the new and competitive product
portfolio. Operating income increased by 6%
and amounted to SEK 1,002 M.
As an effect of the recovery in the aerospace
industry, volumes rose for Volvo Aero. In
November, the decision was taken to phase out
maintenance operations in Bromma, which had
reported loss for many years. Earnings were
negatively affected in an amount of SEK 258 M
for discontinuation costs. Operating income for
2006 decreased to SEK 345 M compared to
SEK 836 M for 2005.
The operating income includes a positive
effect of SEK 357 M as a consequence of the
Brazilian Supreme Court’s decision to rule in
AB Volvo’s favor in an export credits dispute. In
addition, costs of SEK 258 M relating to the
decision in principle on closure of Volvo Aero’s
operations in Bromma, Sweden, SEK 100 M
from capacity adjustments in North America
and approximately SEK 1,100 M related to
costs for the changeover in the industrial sys-
tems and production starts of new engines and
trucks primarily in Renault Trucks. The operat-
ing income for 2005 included costs of approxi-
mately SEK 500 for product launches and pro-
duction starts, costs amounting to SEK 653 M
related to Volvo’s holdings in Peach County
Holding Inc. (bus manufacturer Blue Bird) and
a capital gain from the sale of Celero Support
amounting to approximately SEK 430 M.
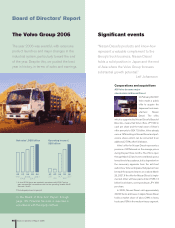
Change in operating income
SEK bn
Operating income 2005 18.2
Higher volumes and improvement
of gross margins 5.8
Higher income from Financial Services 0.5
Changes in currency exchange rates (1.0)
Lower capitalization of development costs (0.6)
Higher research and development
expenditures (0.2)
Higher selling and administrative
expenses (0.6)
Adjustment of Goodwill in subsidiary
Mack Trucks (1.7)
Restructuring costs Volvo Aero, Bromma (0.3)
Outcome of dispute regarding export
credits in Brasil 0.4
Other (0.1)
Operating income 2006 20.4
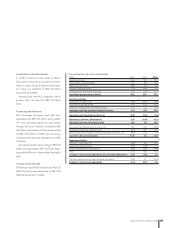
Operating margin
% 2004 2005 2006
Trucks 6.6 7.5 8.6
Buses 2.0 2.8 3.8
Construction Equipment 6.5 7.9 9.6
Volvo Penta 10.4 9.6 9.6
Volvo Aero 5.8 11.1 4.3
Volvo Group 1 6.9 7.9 8.9
Volvo Group 7.3 7.9 8.2
1 Excluding revaluation of shares in Scania AB and
Henlys Group Plc, and excluding goodwill adjust-
ment in 2006.
7.6
05
8.4
06
6.8
03
5.9
Research and
development
costs, SEK bn
Research and
development
costs, % of
net sales
02
7.6
3.3 3.43.93.3 3.8
04
Research and development costs1
1 Years 2004, 2005 and 2006 are reported in accord-
ance with IFRS and 2002 and 2003 in accordance with
Swedish GAAP. See Note 1 and 3.
Board of Directors’ Report 2006 51