Volvo 2006 Annual Report Download - page 70
Download and view the complete annual report
Please find page 70 of the 2006 Volvo annual report below. You can navigate through the pages in the report by either clicking on the pages listed below, or by using the keyword search tool below to find specific information within the annual report.-
 1
1 -
2
-
3
-
4
-
5
-
6
-
7
-
8
-
9
-
10
-
11
-
12
-
13
-
14
-
15
-
16
-
17
-
18
-
19
-
20
-
21
-
22
-
23
-
24
-
25
-
26
-
27
-
28
-
29
-
30
-
31
-
32
-
33
-
34
-
35
-
36
-
37
-
38
-
39
-
40
-
41
-
42
-
43
-
44
-
45
-
46
-
47
-
48
-
49
-
50
-
51
-
52
-
53
-
54
-
55
-
56
-
57
-
58
-
59
-
 60
60 -
 61
61 -
 62
62 -
 63
63 -
 64
64 -
 65
65 -
 66
66 -
 67
67 -
 68
68 -
 69
69 -
 70
70 -
 71
71 -
 72
72 -
 73
73 -
 74
74 -
 75
75 -
 76
76 -
 77
77 -
 78
78 -
 79
79 -
 80
80 -
81
-
82
-
83
-
84
-
85
-
86
-
87
-
88
-
89
-
90
-
91
-
92
-
93
-
94
-
95
-
96
-
97
-
98
-
99
-
100
-
101
-
102
-
103
-
104
-
105
-
106
-
107
-
108
-
109
-
110
-
111
-
112
-
113
-
114
-
115
-
116
-
117
-
118
-
119
-
120
-
121
-
122
-
123
-
124
-
125
-
126
-
127
-
128
-
129
-
130
-
131
-
132
-
133
-
134
-
135
-
136
-
137
-
138
-
139
-
140
-
141
-
142
-
143
-
144
-
145
-
146
-
147
-
148
-
149
-
150
-
151
-
152
-
153
-
154
-
155
-
156
-
157
-
158
-
159
-
160
-
161
-
162
-
163
-
164
-
165
-
166
-
167
-
168
-
169
-
170
 |
 |

05 06
166.3
0302
118.8 136.9
117.0 155.4
04
Operating income1,2, SEK bn
05
7.5
06
8.6
03
3.4
02
1.0
04
6.6
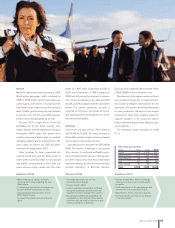
Total market
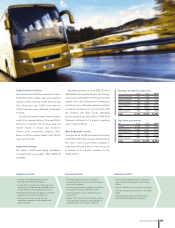
>>> The number of trucks sold reached record
levels primarily in Europe and North America,
exceeding the previous all-time-highs reported
in 2005. Demand in Europe seems to be con-
tinuing on this positive trend. Particularly note-
worthy in this respect is that the new EU mem-
bers in Eastern Europe are reporting sharp
increases in truck sales.
Developments in Asia in 2006 point to favor-
able economic growth in several markets, with
major markets such as China and India report-
ing rising sales of heavy trucks.
In Brazil truck sales declined i.a. due to such
factors as a strong domestic currency in rela-
tion to the USD, resulting in problems for key
agricultural exports.
In 2006 the total market in Europe 27 in -
creased by 7%, amounting to 295,038
(276,822) vehicles, whereof Western Europe
Net sales 1, SEK bn Operating margin1,2, %
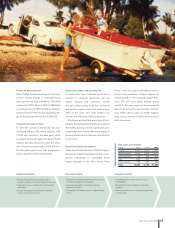
Trucks
– strong demand in 2006
The global market for heavy trucks remained at a very high level
in 2006 as a result of strong economic conditions that have
favored road transport operations in recent years.
grew by 4% and the new EU countries advan-
cing a full 34%. Moreover, in Russia the number
of imported trucks increased by approximately
90%.
In North America, the overall market for
heavy trucks (class 8) in 2006 rose 13% to
348,866 (307,973), with the USA reporting
growth of 12% to 284,008 vehicles (252,792).
The Brazilian market retreated 9% to 39,873
vehicles in 2006. Among the major markets in
Asia, Japan grew 6%, China 29% and India
41%. In the Middle East, however, the overall
market fell 50%, due largely to the decline in
Iran, which fell by a full 94%.
Market shares
In 2006, Volvo Trucks’ market share in Europe
27 was 14.2% a decrease by 0.1 percentage
point compared to 2005. The decline was
mainly due to lower market shares in the UK,
05 06030204
1.2 4.0 9.0 11.7 14.4
partly offset by an increase in Italy and France.
Renault Trucks’ market share in Europe was
10.6% for heavy trucks (10.7). In the medium
heavy truck segment (10–16 tons) the market
share was 15.3% (15.8) for Renault Trucks and
3.8% (5.3) for Volvo Trucks. The development
in Volvo Trucks was mainly due to lower deliver-
ies in conjunction with production change-over
for the new distribution trucks.
In Russia, Volvo Trucks’ import share was
25.6%.
In North America Mack’s market share
declined by 0.4 percentage points to 9.2%,
mainly due to a combination of factors related
to product renewal activities, supply issues
associated with record volumes and regional
softening in certain market segments. Volvo
Trucks’ market share in North America rose 0.3
percentage points to 10.2%.
1 Years 2004, 2005 and 2006 are reported in accordance
with IFRS and 2002 and 2003 in accordance with
Swedish GAAP. See Note 1 and 3.
2 Excluding adjustment of goodwill.
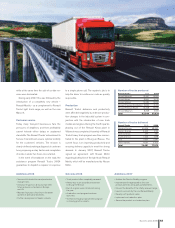
In all of Europe there is an increased need for trans-
ports and especially between the Western and
Eastern parts of Europe, which means an increased
need for heavy trucks.
Net sales as percentage
of Volvo Group’s sales
67%
66Business areas 2006