Volvo 2006 Annual Report Download - page 57
Download and view the complete annual report
Please find page 57 of the 2006 Volvo annual report below. You can navigate through the pages in the report by either clicking on the pages listed below, or by using the keyword search tool below to find specific information within the annual report.-
 1
1 -
2
-
3
-
4
-
5
-
6
-
7
-
8
-
9
-
10
-
11
-
12
-
13
-
14
-
15
-
16
-
17
-
18
-
19
-
20
-
21
-
22
-
23
-
24
-
25
-
26
-
27
-
28
-
29
-
30
-
31
-
32
-
33
-
34
-
35
-
36
-
37
-
38
-
39
-
40
-
41
-
42
-
43
-
44
-
45
-
46
-
 47
47 -
 48
48 -
 49
49 -
 50
50 -
 51
51 -
 52
52 -
 53
53 -
 54
54 -
 55
55 -
 56
56 -
 57
57 -
 58
58 -
 59
59 -
 60
60 -
 61
61 -
 62
62 -
 63
63 -
 64
64 -
 65
65 -
 66
66 -
 67
67 -
68
-
69
-
70
-
71
-
72
-
73
-
74
-
75
-
76
-
77
-
78
-
79
-
80
-
81
-
82
-
83
-
84
-
85
-
86
-
87
-
88
-
89
-
90
-
91
-
92
-
93
-
94
-
95
-
96
-
97
-
98
-
99
-
100
-
101
-
102
-
103
-
104
-
105
-
106
-
107
-
108
-
109
-
110
-
111
-
112
-
113
-
114
-
115
-
116
-
117
-
118
-
119
-
120
-
121
-
122
-
123
-
124
-
125
-
126
-
127
-
128
-
129
-
130
-
131
-
132
-
133
-
134
-
135
-
136
-
137
-
138
-
139
-
140
-
141
-
142
-
143
-
144
-
145
-
146
-
147
-
148
-
149
-
150
-
151
-
152
-
153
-
154
-
155
-
156
-
157
-
158
-
159
-
160
-
161
-
162
-
163
-
164
-
165
-
166
-
167
-
168
-
169
-
170
 |
 |
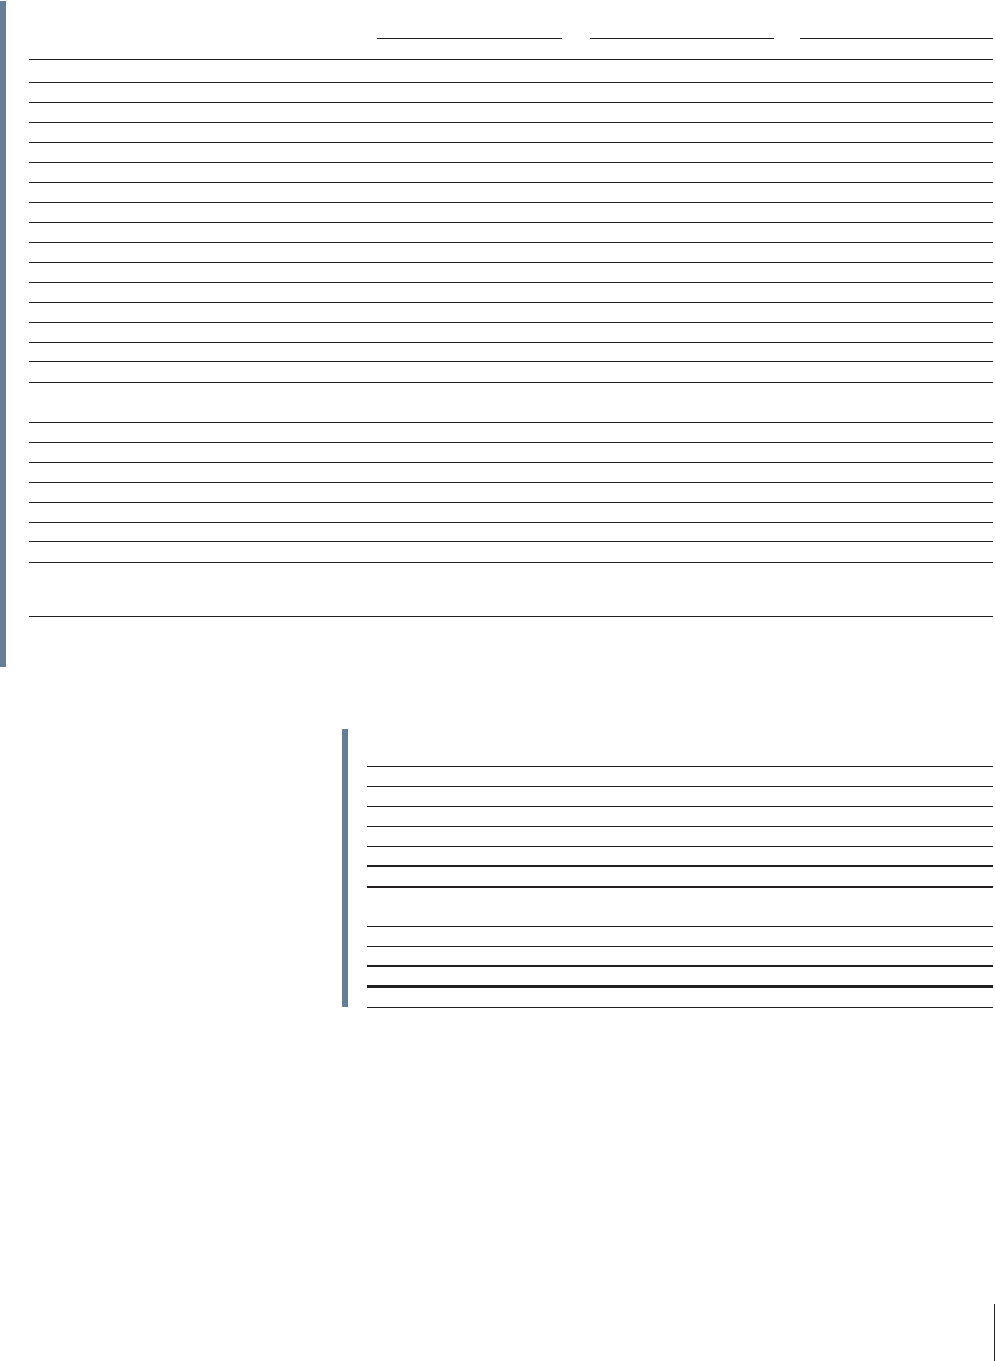
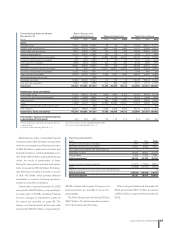
Net financial position
SEK M 2004 2005 2006
Long-term interest-bearing receivables 1,797 1,399 3,463
Short-term interest bearing receivables 10,330 6,292 9,751
Non-current assets held for sale, interest-bearing – – 5
Marketable securities 25,839 28,662 20,324
Cash and bank 8,789 7,385 9,583
Total financial assets 46,755 43,738 43,126
Provision for post employment benefits (14,677) (11,966) (8,661)
Loans (13,968) (13,097) (9,779)
Liabilities associated with assets held for sale, interest-bearings – – (7)
Total financial debt (28,645) (25,063) (18,447)
Net financial position 18,110 18,675 24,679
Marketable securities in real estate financial
institutions fell by SEK 12.9 billion during 2006,
which to some degree was offset by an increase
of SEK 6.6 billion in placements in banks and
financial institutions. In total, marketable secur-
ities fell by SEK 8.5 billion during 2006, among
others the result of amortization of loans.
During the same period, cash and cash equiva-
lents increased by SEK 2.6 billion. Exchange-
rate differences resulted in a decline in assets
of SEK 14.5 billion, which primarily affected
receivables in customer financing operations,
inventories and other receivables.
Shareholders’ equity at December 31, 2006
amounted to SEK 87.2 billion, corresponding to
an equity ratio of 43.5%, excluding Financial
Services. Changes in shareholders’ equity for
the period are specified on page 89. The
Group’s net financial assets at the same date
amounted to SEK 24.7 billion, corresponding to
28.3% of shareholders’ equity. Changes in net
financial position are specified in the accom-
panying table.
The Volvo Group’s loans fell during 2006 by
SEK 7.9 billion. The decline was due to a reduc-
tion in bond loans and other loans.
Total contingent liabilities at December 31,
2006, amounted to SEK 7.7 billion, a reduction
of SEK 0.2 billion compared with December 31,
2005.
Consolidated balance sheets Volvo Group, excl
December 31 Financial Services1 Financial Services Total Volvo Group
SEK M 2004 2005 2006 2004 2005 2006 2004 2005 2006
Assets
Intangible assets 17,570 20,348 19,054 42 73 62 17,612 20,421 19,117
Property, plant and equipment 27,260 31,330 30,493 3,891 3,738 3,886 31,151 35,068 34,379
Assets under operating leases 8,477 10,260 11,822 773 700 279 19,534 20,839 20,501
Shares and participations 10,116 10,357 16,565 193 28 29 2,003 751 6,890
Long-term customer-financing receivables 147 725 582 33,887 39,083 39,276 25,187 31,184 32,089
Long-term interest-bearing receivables 1,797 1,399 3,463 5 60 60 1,741 1,433 3,150
Other long-term receivables 6,492 7,242 7,723 212 271 393 6,100 7,026 7,913
Inventories 28,291 33,583 33,893 307 342 318 28,598 33,937 34,211
Short-term customer-financing receivables 83 652 611 29,531 38,907 36,979 26,006 33,282 32,653
Short-term interest-bearing receivables 10,330 6,292 9,751 0 0 0 1,643 464 966
Other short-term receivables 30,043 36,750 35,612 1,628 1,607 1,564 29,647 35,855 34,654
Non-current assets held for sale 2 – – 805 – – – – – 805
Marketable securities 25,839 28,662 20,324 116 172 18 25,955 28,834 20,342
Cash and cash equivalents 8,789 7,385 9,583 914 868 1,238 8,791 8,113 10,757
Total assets 175,234 194,985 200,281 71,499 85,849 84,102 223,968 257,207 258,427
Shareholders’ equity and liabilities
Shareholders’ equity 3 70,155 78,760 87,188 8,306 9,634 9,703 70,155 78,760 87,188
Provisions for post-employment benefits 14,677 11,966 8,661 26 20 31 14,703 11,986 8,692
Other provisions 14,115 17,164 19,385 845 1,264 1,321 14,993 18,556 20,970
Loans 13,968 13,097 9,779 57,860 69,993 67,991 61,807 74,885 66,957
Liabilities associated with assets held for sale 4 – – 280 – – – – – 280
Other liabilities 62,319 73,998 74,988 4,462 4,938 5,056 62,310 73,020 74,340
Shareholders’ equity and liabilities 175,234 194,985 200,281 71,499 85,849 84,102 223,968 257,207 258,427
Shareholders’ equity and minority interests
as percentage of total assets 40.0 40.4 43.5 11.6 11.2 11.5 31.3 30.6 33.7
1 Financial Services reported in accordance with the
equity method.
2 Of which, interest-bearing SEK 5 M (–; –).
3 Of which, minority interests SEK 284 M (260; 229).
4 Of which, interest-bearing SEK 7 M (–; –).
Board of Directors’ Report 2006 53