Volvo 2006 Annual Report Download - page 111
Download and view the complete annual report
Please find page 111 of the 2006 Volvo annual report below. You can navigate through the pages in the report by either clicking on the pages listed below, or by using the keyword search tool below to find specific information within the annual report.-
 1
1 -
2
-
3
-
4
-
5
-
6
-
7
-
8
-
9
-
10
-
11
-
12
-
13
-
14
-
15
-
16
-
17
-
18
-
19
-
20
-
21
-
22
-
23
-
24
-
25
-
26
-
27
-
28
-
29
-
30
-
31
-
32
-
33
-
34
-
35
-
36
-
37
-
38
-
39
-
40
-
41
-
42
-
43
-
44
-
45
-
46
-
47
-
48
-
49
-
50
-
51
-
52
-
53
-
54
-
55
-
56
-
57
-
58
-
59
-
60
-
61
-
62
-
63
-
64
-
65
-
66
-
67
-
68
-
69
-
70
-
71
-
72
-
73
-
74
-
75
-
76
-
77
-
78
-
79
-
80
-
81
-
82
-
83
-
84
-
85
-
86
-
87
-
88
-
89
-
90
-
91
-
92
-
93
-
94
-
95
-
96
-
97
-
98
-
99
-
100
-
 101
101 -
 102
102 -
 103
103 -
 104
104 -
 105
105 -
 106
106 -
 107
107 -
 108
108 -
 109
109 -
 110
110 -
 111
111 -
 112
112 -
 113
113 -
 114
114 -
 115
115 -
 116
116 -
 117
117 -
 118
118 -
 119
119 -
 120
120 -
 121
121 -
122
-
123
-
124
-
125
-
126
-
127
-
128
-
129
-
130
-
131
-
132
-
133
-
134
-
135
-
136
-
137
-
138
-
139
-
140
-
141
-
142
-
143
-
144
-
145
-
146
-
147
-
148
-
149
-
150
-
151
-
152
-
153
-
154
-
155
-
156
-
157
-
158
-
159
-
160
-
161
-
162
-
163
-
164
-
165
-
166
-
167
-
168
-
169
-
170
 |
 |
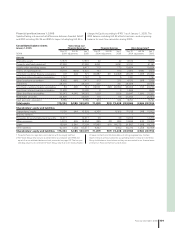
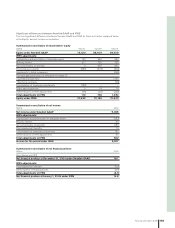
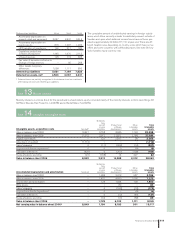
Net sales to Group companies 2004 2005 2006
Trucks 690 752 933
Buses 377 102 96
Construction Equipment 162 127 134
Volvo Penta 27 42 24
Volvo Aero 43 82 86
Other 9,440 10,589 10,788
Eliminations (10,739) (11,694) (12,061)
Total excl Financial Services 0 0 0
Financial Services 693 755 814
Eliminations (693) (755) (814)
Total net sales to Group companies 0 0 0
Internal sales between business areas are generally made at stand-
ard cost of sales, including calculated interest and product improve-
ment expenses. Internal sales from service companies are generally
made at market prices.
Operating income 2004 2005 2006
Trucks 8,992 11,717 12,657
Buses 158 470 633
Construction Equipment 1,898 2,752 3,888
Volvo Penta 940 943 1,002
Volvo Aero 403 836 345
Financial Services 1,365 2,033 2,301
Other 923 (598) (427)
Volvo Group total 14,679 18,153 20,399
Operating income in 2004 included reversal of write-down of shares
in Scania AB of 915, which was reported in Other and write-down of
shares in Henlys Group Plc of 95, which was reported in Buses.
Operating income in 2006 includes adjustment of goodwill of
(1,712), which was reported in Trucks.
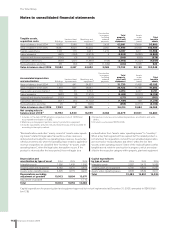
Depreciation and amortization 2004 2005 2006
Trucks 5,306 5,307 7,820
Buses 219 249 281
Construction Equipment 627 658 802
Volvo Penta 122 224 205
Volvo Aero 391 366 363
Other 220 88 23
Total excl Financial Services 6,885 6,892 9,494
Financial Services 3,117 429 344
Reclassifi cation Group versus segment
Financial Services – 2,573 2,545
Volvo Group total
1 10,002 9,894 12,383
1 Of which write-down 80 (72; 244).
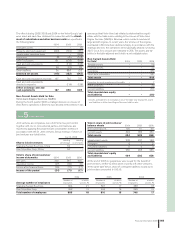
Research and development
expenses 2004 2005 2006
Trucks 5,491 5,200 5,872
Buses 484 569 603
Construction Equipment 1,033 1,083 1,008
Volvo Penta 311 413 445
Volvo Aero 209 225 288
Other 86 67 138
Volvo Group total 7,614 7,557 8,354
Income from investments in
associated companies 2004 2005 2006
Trucks 13 (6) 23
Buses 1 7 10
Construction Equipment – 0 0
Volvo Penta – 0 0
Volvo Aero (1) 68 8
Other (11) (637) 19
Volvo Group excl
Financial Services 2 (568) 60
Financial Services 25 11 1
Volvo Group total 27 (557) 61
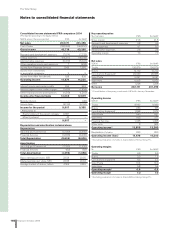
Total assets 2004 2005 2006
Operating assets, excluding
Financial Services:
1
Trucks 71,439 83,973 89,188
Buses 8,017 10,499 9,646
Construction Equipment 16,858 21,437 24,040
Volvo Penta 3,242 3,700 3,931
Volvo Aero 8,695 10,118 10,102
Other
3,881 2,938 644
Total operating assets
excluding Financial Services 112,132 132,665 137,551
Interest-bearing fi n ancial assets 46,312 43,939 43,126
Tax receivables 6,259 5,986 7,476
Total assets in Financial Services 71,499 85,849 84,102
Other and eliminations (12,234) (11,232) (13,828)
Volvo Group total 223,968 257,207 258,427
1 Defi ned as Total assets less Interest-bearing fi n ancial assets and Tax
receivables.
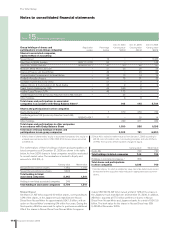
Total shareholders’ equity
and liabilities 2004 2005 2006
Operating liabilities, excluding
Financial Services:1
Trucks 55,105 62,743 65,586
Buses 3,324 4,728 4,565
Construction Equipment 6,602 9,350 11,177
Volvo Penta 1,620 1,820 2,111
Volvo Aero 3,695 4,622 4,186
Other 2,788 2,793 956
Total operating liabilities
excluding Financial Services 73,134 86,056 88,581
Financial liabilities 28,402 24,670 18,446
Tax liabilities 1,608 2,578 4,624
Total liabilities in Financial Services 63,193 76,214 74,399
Other and eliminations (12,524) (11,071) (14,811)
Total liabilities 153,813 178,447 171,239
Shareholders’ equity 70,155 78,760 87,188
Volvo Group total 223,968 257,207 258,427
1 Defi ned as Total liabilities less shareholders equity, fi nancial liabilities and
tax liabilities.
Financial information 2006 107