Volvo 2006 Annual Report Download - page 54
Download and view the complete annual report
Please find page 54 of the 2006 Volvo annual report below. You can navigate through the pages in the report by either clicking on the pages listed below, or by using the keyword search tool below to find specific information within the annual report.-
 1
1 -
2
-
3
-
4
-
5
-
6
-
7
-
8
-
9
-
10
-
11
-
12
-
13
-
14
-
15
-
16
-
17
-
18
-
19
-
20
-
21
-
22
-
23
-
24
-
25
-
26
-
27
-
28
-
29
-
30
-
31
-
32
-
33
-
34
-
35
-
36
-
37
-
38
-
39
-
40
-
41
-
42
-
43
-
 44
44 -
 45
45 -
 46
46 -
 47
47 -
 48
48 -
 49
49 -
 50
50 -
 51
51 -
 52
52 -
 53
53 -
 54
54 -
 55
55 -
 56
56 -
 57
57 -
 58
58 -
 59
59 -
 60
60 -
 61
61 -
 62
62 -
 63
63 -
 64
64 -
65
-
66
-
67
-
68
-
69
-
70
-
71
-
72
-
73
-
74
-
75
-
76
-
77
-
78
-
79
-
80
-
81
-
82
-
83
-
84
-
85
-
86
-
87
-
88
-
89
-
90
-
91
-
92
-
93
-
94
-
95
-
96
-
97
-
98
-
99
-
100
-
101
-
102
-
103
-
104
-
105
-
106
-
107
-
108
-
109
-
110
-
111
-
112
-
113
-
114
-
115
-
116
-
117
-
118
-
119
-
120
-
121
-
122
-
123
-
124
-
125
-
126
-
127
-
128
-
129
-
130
-
131
-
132
-
133
-
134
-
135
-
136
-
137
-
138
-
139
-
140
-
141
-
142
-
143
-
144
-
145
-
146
-
147
-
148
-
149
-
150
-
151
-
152
-
153
-
154
-
155
-
156
-
157
-
158
-
159
-
160
-
161
-
162
-
163
-
164
-
165
-
166
-
167
-
168
-
169
-
170
 |
 |

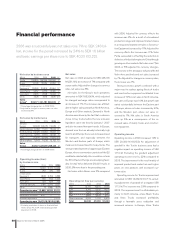
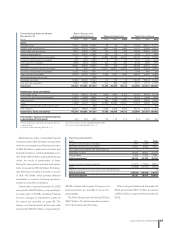
Financial performance
2006 was a successful year, net sales rose 7% to SEK 248 bil-
lion, income for the period increased by 24% to SEK 16 billion
and basic earnings per share rose to SEK 40.20 (32.22).
Net sales
Net sales in 2006 amounted to SEK 248,135
M (231,191), an increase of 7% compared with
a year earlier. Adjusted for changes in currency
rates, net sales rose 8%.
Net sales for the Group’s truck operations
amounted to SEK 166,306 M, which adjusted
for changed exchange rates corresponded to
an increase of 7%. The increase was attribut-
able to higher sales, primarily in North America,
Europe and Other markets. Demand in North
America was driven by the fact that customers
chose to buy trucks before the new emission
legislation came into force by January 1 2007
and also increased transport needs. In Europe,
demand rose from an already historically high
level. In all of Europe there is an increased need
for transports and especially between the
Western and Eastern parts of Europe, which
means an increased need for heavy trucks. The
strongest development is happening in Eastern
Europe, where new member countries of the EU
contribute substantially. Also countries outside
the EU in Eastern Europe are developing favor-
ably. In total, Volvo delivered 219,931 trucks in
2006, 3% more than in the preceding year.
Net sales within Buses rose 2% compared
with 2005. Adjusted for currency effects the
increase was 2%. As a result of a broadened
production range and improved market shares
in a rising world market, net sales in Construc-
tion Equipment increased by 17% . Adjusted for
currency ef fects the increase was 17%. Volvo
Penta succeeded in offsetting the reduction in
deliveries of industrial engines to China through
growing on other markets. Net sales rose 7% in
2006, or 8% adjusted for currency changes.
The recovery in the aerospace industry affected
Volvo Aero positively and net sales increased
by 7%. Adjusted for changes in currency rates,
the increase was 7%.
Strong economic growth combined with a
major need to replace ageing fleets of trucks
and construction equipment contributed to an
increase of 10% in net sales in North America.
Net sales in Europe was 10%, but growth rate
varied substantially between the Eastern part
of Europe, where net sales increased by 41%,
and the Western part, where net sales in -
creased by 7%. Net sales in South America
were up 5% as a consequence of the in -
creased sales of mainly trucks and construc-
tion equipment.
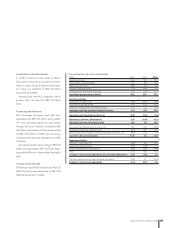
Operating income
Operating income in 2006 increased 12% to
SEK 20,399 M (18,153). An adjustment of
goodwill in the Trucks business area had a
negative impact on operating income of SEK
1,712 M. Excluding the goodwill adjustment
operating income rose by 22% compared to
2005. The improvement is the result mainly of
improved product and market mix and higher
prices on new products with increased cus-
tomer value.
Operating income for Trucks improved and
amounted to SEK 14,369 M (11,717), exclud-
ing adjustment of goodwill of a negative SEK
1,712 M. The increase was 23% compared to
2005. The improved result is attributable pri-
marily to North America, where Mack Trucks
and Volvo Trucks increased profitability
through a favorable price realization and
increased volumes. In Europe, Volvo Trucks
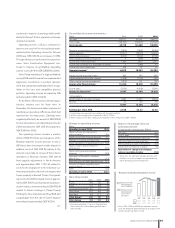
Net sales by market area
SEK M 2004 2005 2006 %
1
Western
Europe 102,498 106,479 113,569 7
Eastern Europe 10,556 11,401 16,044 41
North America 52,426 67,233 73,657 10
South America 6,949 11,901 12,533 5
Asia 20,699 22,598 19,610 (13)
Other markets 9,043 11,579 12,722 10
Volvo
Group
202,171 231,191 248,135 7
1 Percentage change pertains to 2006/2005.
Operating income (loss)
by business area
SEK M 2004 2005 2006
Trucks 8,992 11,717 14,369
Buses 253 470 633
Construction
Equipment 1,898 2,752 3,888
Volvo Penta 940 943 1,002
Volvo Aero 403 836 345
Financial Services 1,365 2,033 2,301
Other 8 (598) (427)
Operating income
1 13,859 18,153 22,111
Revaluation of shares 820 – –
Goodwill adjustment – – (1,712)
Operating income 14,679 18,153 20,399
1 Excluding revaluation of shares in Scania AB and
Henlys Group Plc, 2004, and excluding goodwill
adjustment in 2006.
Net sales by business area
SEK M 2004 2005 2006 %
1
Trucks 136,879 155,396 166,306 7
Buses 12,722 16,589 16,856 2
Construction
Equipment 29,360 34,816 40,564 17
Volvo Penta 9,057 9,776 10,485 7
Volvo Aero 6,925 7,538 8,048 7
Other 7,228 7,076 5,876 (17)
Volvo
Group
2 202,171 231,191 248,135 7
1 Percentage change pertains to 2006/2005.
2 Adjusted for changes in currency rates, net sales
increased by 8%.
Operating net flow per currency
SEK M 2004 2005 2006
USD 13,100 18,300 17,700
EUR 6,700 9,300 14,100
GBP 4,200 5,200 5,700
CAD 2,800 3,300 2,700
Other currencies 9,300 11,100 10,800
Total 36,100 47,200 51,000
50 Board of Directors’ Report 2006