Volvo 2006 Annual Report Download - page 21
Download and view the complete annual report
Please find page 21 of the 2006 Volvo annual report below. You can navigate through the pages in the report by either clicking on the pages listed below, or by using the keyword search tool below to find specific information within the annual report.-
 1
1 -
2
-
3
-
4
-
5
-
6
-
7
-
8
-
9
-
10
-
 11
11 -
 12
12 -
 13
13 -
 14
14 -
 15
15 -
 16
16 -
 17
17 -
 18
18 -
 19
19 -
 20
20 -
 21
21 -
 22
22 -
 23
23 -
 24
24 -
 25
25 -
 26
26 -
 27
27 -
 28
28 -
 29
29 -
 30
30 -
 31
31 -
32
-
33
-
34
-
35
-
36
-
37
-
38
-
39
-
40
-
41
-
42
-
43
-
44
-
45
-
46
-
47
-
48
-
49
-
50
-
51
-
52
-
53
-
54
-
55
-
56
-
57
-
58
-
59
-
60
-
61
-
62
-
63
-
64
-
65
-
66
-
67
-
68
-
69
-
70
-
71
-
72
-
73
-
74
-
75
-
76
-
77
-
78
-
79
-
80
-
81
-
82
-
83
-
84
-
85
-
86
-
87
-
88
-
89
-
90
-
91
-
92
-
93
-
94
-
95
-
96
-
97
-
98
-
99
-
100
-
101
-
102
-
103
-
104
-
105
-
106
-
107
-
108
-
109
-
110
-
111
-
112
-
113
-
114
-
115
-
116
-
117
-
118
-
119
-
120
-
121
-
122
-
123
-
124
-
125
-
126
-
127
-
128
-
129
-
130
-
131
-
132
-
133
-
134
-
135
-
136
-
137
-
138
-
139
-
140
-
141
-
142
-
143
-
144
-
145
-
146
-
147
-
148
-
149
-
150
-
151
-
152
-
153
-
154
-
155
-
156
-
157
-
158
-
159
-
160
-
161
-
162
-
163
-
164
-
165
-
166
-
167
-
168
-
169
-
170
 |
 |

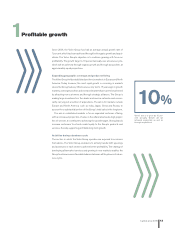
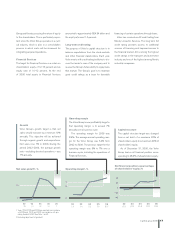
Net sales growth1, % Operating margin1, %
7.9
05
8.92
06
1.6
02
0
7
5
1.4
03
7.3
04
Growth
Volvo Group’s growth target is that net
sales should increase by a minimum 10%
annually. This objective will be achieved
through organic growth and acquisitions.
Net sales rose 7% in 2006. During the
period 2002–2006, the average growth
rate – excluding divested operations – was
7% annually.
Operating margin
The Volvo Group’s new profitability target is
that operating margin is to exceed 7%
annually over a business cycle.
The operating margin for 2006 was
8.9%. The average annual operating mar-
gin for the Volvo Group was 5.4% from
2002 to 2006. The previous target for the
operating margin was 5% to 7% over a
business cycle, including the operations of
Financial Services.
Capital structure
The capital structure target was changed
from a net debt of a maximum 30% of
shareholders’ equity to a maximum 40% of
shareholders’ equity.
As of December 31, 2006, the Volvo
Group had a net financial position corre-
sponding to 28.3% of shareholders’ equity.
1 Years 2004, 2005 and 2006 are reported in accordance
with IFRS and 2002 and 2003 in accordance with pre-
vailing Swedish GAAP. See Note 1 and 3.
2 Excluding adjustment of goodwill.
Group and thereby securing the return of equity
to the shareholders. This is particularly impor-
tant since the Volvo Group operates in a cycli-
cal industry, which is also in a consolidation
process in which costs will be increased for
integrating acquired operations.
Financial Services
The target for Financial Services is a return on
shareholders’ equity of 12–15 percent and an
equity ratio of 10–12 percent. At the end
of 2006 total assets in Financial Services
amounted to approximately SEK 84 billion and
the equity ratio was 11.5 percent.
Long-term credit rating
The purpose of Volvo’s capital structure is to
balance expectations from the stock markets
and other financial stakeholders. Each year,
Volvo meets with credit rating institutes to dis-
cuss the lender’s view of the company and to
assess the Group’s future ability to repay loans
that mature. The Group’s goal is to maintain
good credit ratings as a base for favorable
financing of certain operations through loans.
Volvo has received an A3 credit rating from
Moody’s Investor Services. The long-term A3
credit rating provides access to additional
sources of financing and improved access to
the financial market. A3 is among the highest
credit ratings in the transport and automotive
industry and one of the highest among Nordic
industrial companies.
14
05
7
06
(2)
02
0
10
(1)
03
16
04
23.7
05
28.3
06
(7.7)
02
(3.3)
03
25.8
04
40
20
−20
−40
0
Net financial position as percentage
of shareholders’ equity1,%
A global group 2006 17