Volvo 2006 Annual Report Download - page 122
Download and view the complete annual report
Please find page 122 of the 2006 Volvo annual report below. You can navigate through the pages in the report by either clicking on the pages listed below, or by using the keyword search tool below to find specific information within the annual report.-
 1
1 -
2
-
3
-
4
-
5
-
6
-
7
-
8
-
9
-
10
-
11
-
12
-
13
-
14
-
15
-
16
-
17
-
18
-
19
-
20
-
21
-
22
-
23
-
24
-
25
-
26
-
27
-
28
-
29
-
30
-
31
-
32
-
33
-
34
-
35
-
36
-
37
-
38
-
39
-
40
-
41
-
42
-
43
-
44
-
45
-
46
-
47
-
48
-
49
-
50
-
51
-
52
-
53
-
54
-
55
-
56
-
57
-
58
-
59
-
60
-
61
-
62
-
63
-
64
-
65
-
66
-
67
-
68
-
69
-
70
-
71
-
72
-
73
-
74
-
75
-
76
-
77
-
78
-
79
-
80
-
81
-
82
-
83
-
84
-
85
-
86
-
87
-
88
-
89
-
90
-
91
-
92
-
93
-
94
-
95
-
96
-
97
-
98
-
99
-
100
-
101
-
102
-
103
-
104
-
105
-
106
-
107
-
108
-
109
-
110
-
111
-
 112
112 -
 113
113 -
 114
114 -
 115
115 -
 116
116 -
 117
117 -
 118
118 -
 119
119 -
 120
120 -
 121
121 -
 122
122 -
 123
123 -
 124
124 -
 125
125 -
 126
126 -
 127
127 -
 128
128 -
 129
129 -
 130
130 -
 131
131 -
 132
132 -
133
-
134
-
135
-
136
-
137
-
138
-
139
-
140
-
141
-
142
-
143
-
144
-
145
-
146
-
147
-
148
-
149
-
150
-
151
-
152
-
153
-
154
-
155
-
156
-
157
-
158
-
159
-
160
-
161
-
162
-
163
-
164
-
165
-
166
-
167
-
168
-
169
-
170
 |
 |

118 Financial information 2006
The Volvo Group
Notes to consolidated financial statements
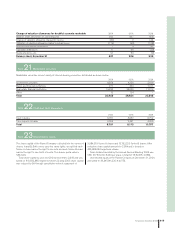
Earnings per share
Earnings per share is calculated as income for the period, attribut-
able to the Parent Company’s shareholders, divided by the Parent
Company’s average number of shares outstanding for the fi s cal year.
Diluted earnings per share is calculated as income for the period
attributable to the Parent Company’s shareholders divided by the
average number of shares outstanding plus the average number of
shares that would be issued as in effect of ongoing share-based
incentive programs and employee stock option programs. If during
the year there were potential shares redeemed or expired during the
period, these are also included in the average number of shares
used to calculate the earnings per share after dilution. To the extent
that employee stock options are not fully earned, the average price
of the share is adjusted.
The share-based incentive program creates a dilution effect when
the non-market-based fi nancial goals are achieved for the fi s cal year.
Similarly, the employee stock option program creates a dilution
effect by taking into account the difference between the exercise
price and the share’s average market price to determine how many
shares that are assumed to be issued without any payment. It is
solely this number of shares that have an effect on the calculated
diluted earnings. The number of shares that this value symbolizes is
less than the total potential number of shares attributable to the
employee stock option program.
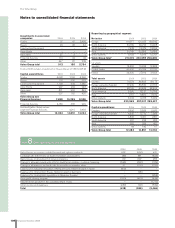
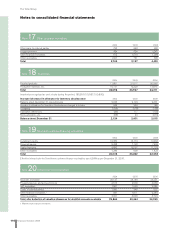
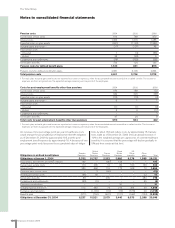
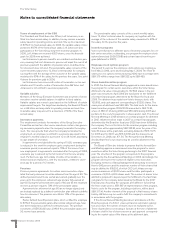
Available for
Change in other reserves Hedgereserve sale-reserve Total
Balance at January 1, 2006 (411) 83 (328)
Fair value gains in year 2,583 – 2,583
Tax on fair value gains (723) – (723)
Transfers to income (1,122) – (1,122)
Tax on transfers to income statement 314 – 314
Change in fair value of commodity contracts (53) – (53)
Fair value adjustments regarding holding in Deutz – 392 392
Fair value adjustments regarding holding in Nissan Diesel – (9) (9)
Other (67) – (67)
Balance at December 31, 2006 521 466 987
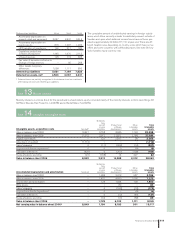
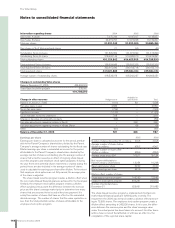
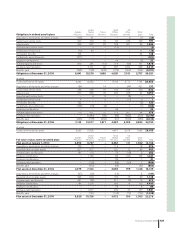
2005 2006
Number of shares, December 31, in millions 404.5 404.8
Average number of shares before
dilution in millions 405.2 404.7
Average number of shares after
dilution in millions 405.9 405.0
Average share price, SEK 319,11 391,94
Net income attributable to
Parent Company shareholders 13,054 16,268
Basic earnings per share 32.22 40.20
Diluted earnings per share 32.16 40.17
Dilution effect, number of shares
Share-based incentive program 166,250 72,583
Employee stock option program 459,241 242,900
Number of potential shares,
December 31 625,491 315,483
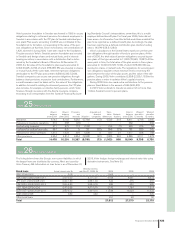
The share-based incentive program is implemented if certain non-
market based fi n ancial goals are fulfi lled partly or wholly. The
requirement for 2006 was met and creates a dilution effect amount-
ing to 72,583 shares. The employee stock option program create a
dilution effect amounting to 242,900 shares. In this case, the differ-
ence between the exercise price and the share’s average value
under the actual period has been taken into account. No other trans-
actions have occurred that affected, or will have an effect on, the
compilation of the reported share capital.
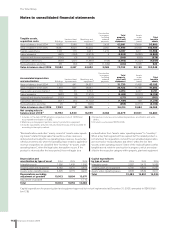
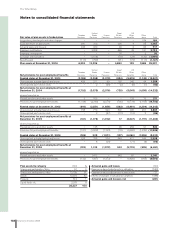
Information regarding shares 2004 2005 2006
Own Series A shares 7,075,246 4,145,627 4,145,627
Own Series B shares 24,315,797 17,074,908 16,739,827
Total own shares 31,391,043 21,220,535 20,885,454
Own shares in % of total registered shares 7,1 5,0 4,9
Outstanding Series A shares 131,529,699 131,374,699 131,374,699
Outstanding Series B shares 278,600,143 273,088,810 273,423,891
Total outstanding shares 410,129,842 404,463,509 404,798,590
Total registered Series A shares 138,604,945 135,520,326 135,520,326
Total registered Series B shares 302,915,940 290,163,718 290,163,718
Total registered shares 441,520,885 425,684,044 425,684,044
Average number of outstanding shares 418,528,078 405,242,037 404,663,051
Changes in outstanding Volvo shares
Balance December 31, 2005 404,463,509
Share-based incentive program 335,081
404,798,590