Volvo 2006 Annual Report Download - page 77
Download and view the complete annual report
Please find page 77 of the 2006 Volvo annual report below. You can navigate through the pages in the report by either clicking on the pages listed below, or by using the keyword search tool below to find specific information within the annual report.-
 1
1 -
2
-
3
-
4
-
5
-
6
-
7
-
8
-
9
-
10
-
11
-
12
-
13
-
14
-
15
-
16
-
17
-
18
-
19
-
20
-
21
-
22
-
23
-
24
-
25
-
26
-
27
-
28
-
29
-
30
-
31
-
32
-
33
-
34
-
35
-
36
-
37
-
38
-
39
-
40
-
41
-
42
-
43
-
44
-
45
-
46
-
47
-
48
-
49
-
50
-
51
-
52
-
53
-
54
-
55
-
56
-
57
-
58
-
59
-
60
-
61
-
62
-
63
-
64
-
65
-
66
-
 67
67 -
 68
68 -
 69
69 -
 70
70 -
 71
71 -
 72
72 -
 73
73 -
 74
74 -
 75
75 -
 76
76 -
 77
77 -
 78
78 -
 79
79 -
 80
80 -
 81
81 -
 82
82 -
 83
83 -
 84
84 -
 85
85 -
 86
86 -
 87
87 -
88
-
89
-
90
-
91
-
92
-
93
-
94
-
95
-
96
-
97
-
98
-
99
-
100
-
101
-
102
-
103
-
104
-
105
-
106
-
107
-
108
-
109
-
110
-
111
-
112
-
113
-
114
-
115
-
116
-
117
-
118
-
119
-
120
-
121
-
122
-
123
-
124
-
125
-
126
-
127
-
128
-
129
-
130
-
131
-
132
-
133
-
134
-
135
-
136
-
137
-
138
-
139
-
140
-
141
-
142
-
143
-
144
-
145
-
146
-
147
-
148
-
149
-
150
-
151
-
152
-
153
-
154
-
155
-
156
-
157
-
158
-
159
-
160
-
161
-
162
-
163
-
164
-
165
-
166
-
167
-
168
-
169
-
170
 |
 |
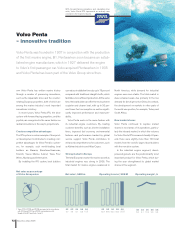
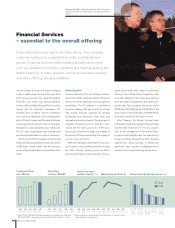
Financial development
Volvo Penta’s financial development through-
out the current decade is characterized by
sales growth and high profitability. This trend
continued in 2006. Sales of SEK 10,485 M and
operating income of SEK 1,002 M are the high-
est ever in Volvo Penta’s history. Operating mar-
gin for the full year amounted to 9.6% (9.6).
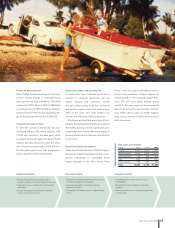
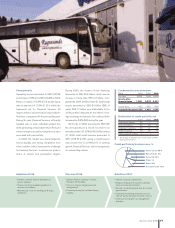
Capacity increase in Vara
To meet the increased demand for the own-
developed D4 and D6 marine engines, SEK
100 M was invested in the Vara plant, which
resulted in increased capacity to about 18,000
engines annually. During the past five years,
Volvo Penta has invested about SEK 800 M in
the Vara plant, which more than doubled pro-
duction and the number of employees.
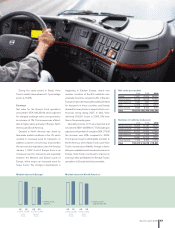
Electronics improves boating life
In recent years, Volvo Penta has moved to the
forefront to introduce electronics into the
marine industry. End customers benefit
through customer value in the form of cleaner
and quieter engines and better performance
while at the same time boat builders can
enhance the efficiency of their production.
Electronics also facilitate a new type of func-
tionality, for example Volvo Penta’s new joystick
that makes docking of boats significantly eas-
ier and safer. Volvo Penta is the only company in
the leisure boat industry that can currently offer
this function.
Growth in industrial engines
Today, Volvo Penta sells about 20,000 engines
annually for industrial applications and, conse-
quently, contributes to substantial diesel
engine synergies in the Volvo Group. Volvo
Penta is now focusing on benefiting from the
Group’s new generation of diesel engines for
further growth in the industrial engine busi-
ness. This will occur partly through strong
growth in the core segment, diesel-powered
gensets, as well as through a broader customer
base within various types of mobile applica-
tions, such as terminal forklifts, stone crushers
and compressors.
• Successively shorter lead times. Decision on
increased capacity in Vara plant.
• Improved operating income and strong
operating margin.
• Strengthened market shares in inboard seg-
ment.
Ambitions 2006
• Increased growth and strong focus on
profitability.
• Broadened customer base in industrial
engines.
• Delivery precision and shortened lead times
in production.
• Ensure more efficient production and
logistics solutions for Volvo Penta customers.
• Ongoing focus on cost control and positive
cash flow.
• Ensure the launch of the Volvo Penta IPS
enjoys continuing success.
Outcome 2006 Ambitions 2007
Net sales per market
SEK M 2004 2005 2006
Europe 4,907 5,102 5,822
North America 2,500 2,832 2,815
South America 142 208 221
Asia 1,324 1,427 1,359
Other markets 184 207 268
Total 9,057 9,776 10,485
Business areas 2006 73