Volvo 2006 Annual Report Download - page 121
Download and view the complete annual report
Please find page 121 of the 2006 Volvo annual report below. You can navigate through the pages in the report by either clicking on the pages listed below, or by using the keyword search tool below to find specific information within the annual report.-
 1
1 -
2
-
3
-
4
-
5
-
6
-
7
-
8
-
9
-
10
-
11
-
12
-
13
-
14
-
15
-
16
-
17
-
18
-
19
-
20
-
21
-
22
-
23
-
24
-
25
-
26
-
27
-
28
-
29
-
30
-
31
-
32
-
33
-
34
-
35
-
36
-
37
-
38
-
39
-
40
-
41
-
42
-
43
-
44
-
45
-
46
-
47
-
48
-
49
-
50
-
51
-
52
-
53
-
54
-
55
-
56
-
57
-
58
-
59
-
60
-
61
-
62
-
63
-
64
-
65
-
66
-
67
-
68
-
69
-
70
-
71
-
72
-
73
-
74
-
75
-
76
-
77
-
78
-
79
-
80
-
81
-
82
-
83
-
84
-
85
-
86
-
87
-
88
-
89
-
90
-
91
-
92
-
93
-
94
-
95
-
96
-
97
-
98
-
99
-
100
-
101
-
102
-
103
-
104
-
105
-
106
-
107
-
108
-
109
-
110
-
 111
111 -
 112
112 -
 113
113 -
 114
114 -
 115
115 -
 116
116 -
 117
117 -
 118
118 -
 119
119 -
 120
120 -
 121
121 -
 122
122 -
 123
123 -
 124
124 -
 125
125 -
 126
126 -
 127
127 -
 128
128 -
 129
129 -
 130
130 -
 131
131 -
132
-
133
-
134
-
135
-
136
-
137
-
138
-
139
-
140
-
141
-
142
-
143
-
144
-
145
-
146
-
147
-
148
-
149
-
150
-
151
-
152
-
153
-
154
-
155
-
156
-
157
-
158
-
159
-
160
-
161
-
162
-
163
-
164
-
165
-
166
-
167
-
168
-
169
-
170
 |
 |
Financial information 2006 117
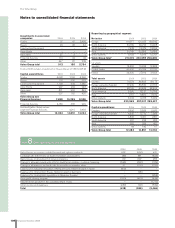
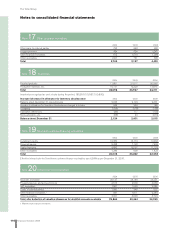
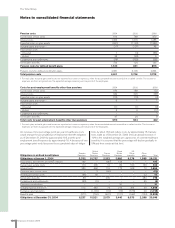
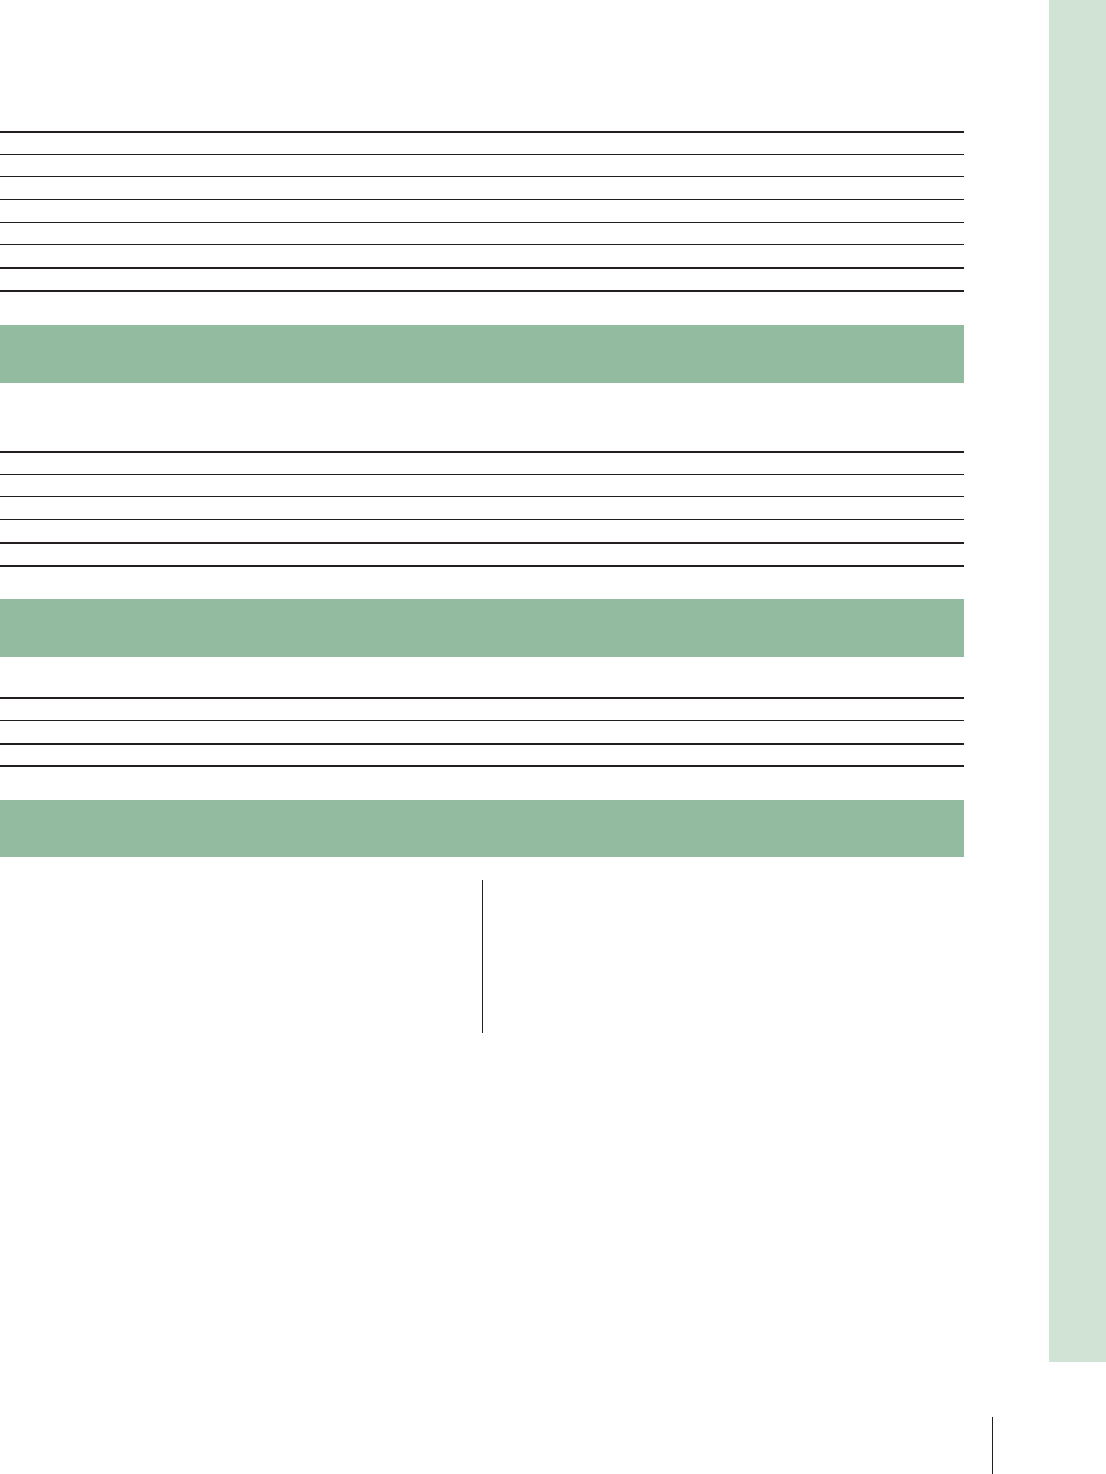
Note 21 Marketable securities
Marketable securities consist mainly of interest-bearing securities, distributed as shown below:
2004 2005 2006
Government securities 6,354 4,226 2,169
Banks and fi nancial institutions 371 464 7,101
Real estate fi nancial institutions 19,220 24,020 11,072
Other 10 124 –
Total 25,955 28,834 20,342
Note 22 Cash and cash equivalents
2004 2005 2006
Cash in banks 5,787 5,652 6,702
Time deposits in banks 3,004 2,461 4,055
Total 8,791 8,113 10,757
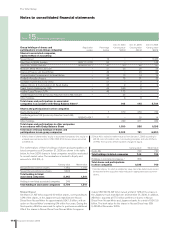
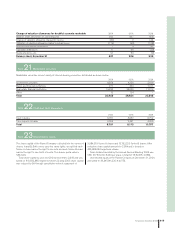
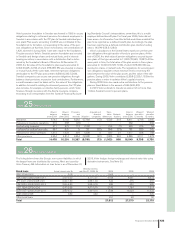
Note 23 Shareholders’ equity
The share capital of the Parent Company is divided into two series of
shares: A and B. Both series carry the same rights, except that each
Series A share carries the right to one vote and each Series B share
carries the right to one tenth of a vote. The shares quota value is
SEK 6.00.
Total share capital by year end 2004 amounted to 2,649 and was
based on 441,520,885 registered shares. During 2005 share capital
was reduced by 95 through cancellation without repayment of
3,084,619 Series A shares and 12,752,222 Series B shares. After
reduction share capital amounts to 2,554 and is based on
425,684,044 registered shares.
Cash dividend decided by the Annual General Meeting 2006 was
SEK 16.75 (12.50; 8.00) per share or total 6,775 (5,055; 3,356).
Unrestricted equity in the Parent Company at December 31, 2006
amounted to 39,345 (41,220; 44,075).
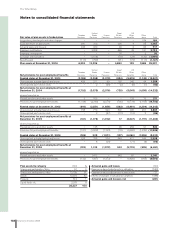
Change of valuation allowances for doubtful accounts receivable 2004 2005 2006
Balance sheet, December 31, preceding year 932 837 906
Change of valuation allowance charged to income (30) 2 144
Utilization of valuation allowance related to actual losses (174) (90) (108)
Acquired and divested operations 1 9 45
Translation differences 17 95 (39)
Reclassifi cations, etc. 91 53 (9)
Balance sheet, December 31 837 906 939