Volvo 2006 Annual Report Download - page 134
Download and view the complete annual report
Please find page 134 of the 2006 Volvo annual report below. You can navigate through the pages in the report by either clicking on the pages listed below, or by using the keyword search tool below to find specific information within the annual report.-
 1
1 -
2
-
3
-
4
-
5
-
6
-
7
-
8
-
9
-
10
-
11
-
12
-
13
-
14
-
15
-
16
-
17
-
18
-
19
-
20
-
21
-
22
-
23
-
24
-
25
-
26
-
27
-
28
-
29
-
30
-
31
-
32
-
33
-
34
-
35
-
36
-
37
-
38
-
39
-
40
-
41
-
42
-
43
-
44
-
45
-
46
-
47
-
48
-
49
-
50
-
51
-
52
-
53
-
54
-
55
-
56
-
57
-
58
-
59
-
60
-
61
-
62
-
63
-
64
-
65
-
66
-
67
-
68
-
69
-
70
-
71
-
72
-
73
-
74
-
75
-
76
-
77
-
78
-
79
-
80
-
81
-
82
-
83
-
84
-
85
-
86
-
87
-
88
-
89
-
90
-
91
-
92
-
93
-
94
-
95
-
96
-
97
-
98
-
99
-
100
-
101
-
102
-
103
-
104
-
105
-
106
-
107
-
108
-
109
-
110
-
111
-
112
-
113
-
114
-
115
-
116
-
117
-
118
-
119
-
120
-
121
-
122
-
123
-
 124
124 -
 125
125 -
 126
126 -
 127
127 -
 128
128 -
 129
129 -
 130
130 -
 131
131 -
 132
132 -
 133
133 -
 134
134 -
 135
135 -
 136
136 -
 137
137 -
 138
138 -
 139
139 -
 140
140 -
 141
141 -
 142
142 -
 143
143 -
 144
144 -
145
-
146
-
147
-
148
-
149
-
150
-
151
-
152
-
153
-
154
-
155
-
156
-
157
-
158
-
159
-
160
-
161
-
162
-
163
-
164
-
165
-
166
-
167
-
168
-
169
-
170
 |
 |

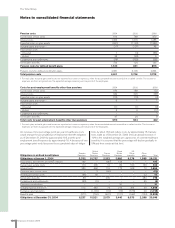
130 Financial information 2006
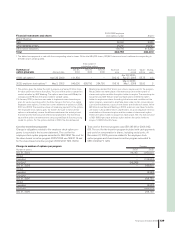
The Volvo Group
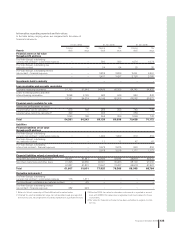
2004 2005 2006
Wages, salaries of which of which of which
and other Board and variable Other Board and variable Other Board and variable Other
remuneration, SEK M Presidents1 salaries employees Presidents1 salaries employees Presidents1 salaries employees
AB Volvo
Sweden 33.4 11.6 106.3 42.8 9.8 97.9 33.4 11.2 170.8
Subsidaries
Sweden 79.3 15.5 9,041.7 84.6 15.6 9,475.6 93.1 29.3 9,760.8
Western Europe 442.3 10.9 8,905.3 436.0 6.3 9,267.6 442.0 8.0 9,380.7
Eastern Europe 14.5 0.2 367.0 25.2 2.0 472.9 37.6 2.9 521.8
North America 209.1 10.2 5,292.7 199.4 17.9 5,965.5 187.5 6.8 6,537.0
South America 7.2 0.0 363.9 9.3 0.0 529.4 22.1 4.1 617.9
Asia 49.9 0.7 724.9 58.9 1.0 957.2 56.7 1.7 1,053.7
Other countries 12.7 0.0 394.5 26.7 0.0 467.5 28.6 0.9 481.7
Group total 848.4 49.1 25,196.3 882.9 52.6 27,233.6 901.0 64.9 28,524.4
2004 2005 2006
Wages, salaries, other Wages, Wages, Wages,
remuneration and salaries, Social of which salaries, Social of which salaries, Social of which
social costs, SEK M remunerations costs pens. costs remunerations costs pens. costs remunerations costs pens. costs
AB Volvo
2 139.7 80.7 48.7 140.7 78.6 46.7 204.2 141.6 104.9
Subsidiaries 25,905.0 10,964.8 4,365.2 27,975.9 10,392.1 3,688.9 29,221.3 10,047.2 3.634,2
Group total
3 26,044.7 11,045.5 4,413.9 28,116.6 10,470.7 3,735.6 29,425.5 10,188.8 3,739.1
1 Including current and former Board members, Presidents and Executive
Vice Presidents.
2 The Parent Company’s pension costs, pertaining to Board members and
Presidents are disclosed in Note 22 in the Parent Company.
3 Of the Group’s pension costs, 181.7 (125.5; 157.8) pertain to Board mem-
bers and Presidents. The Group’s outstanding pension obligations to these
individuals amount to 461.2 (573.8; 838.3).
The cost for non-monetary benefi ts in the Group amounted to
1,247.0 (1.055,9) of which 43.7 (47.6) to Board members and presi-
dents.
The cost for non-monetary benefi ts in the Parent company
amount to 10.1 (14.6) of which 1.3 (3.7) to Board members and
presidents.
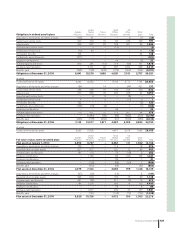
Notes to consolidated financial statements
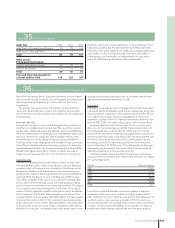
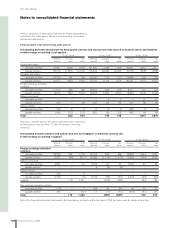
2004 2005 2006
Number of of which Number of of which Number of of which
Average number of employees employees women, % employees women, % employees women, %
AB Volvo
Sweden 136 54 144 50 160 51
Subsidiaries
Sweden 27,034 18 27,699 19 26,722 19
Western Europe 26,325 14 25,894 14 26,380 15
Eastern Europe 2,731 16 3,481 15 4,225 16
North America 13,057 19 13,778 20 14,609 20
South America 3,040 12 3,656 14 3,874 13
Asia 4,114 16 4,273 15 4,075 15
Other countries 1,759 11 2,259 12 2,255 12
Group total 78,196 16 81,184 17 82,300 17
2004 2005 2006
Number at of which Number at of which Number at of which
Board members and chief offi cers year-end women, % year-end women, % year end women, %
AB Volvo
Board members 11 9 11 9 11 9
CEO and GEC 17 6 17 6 17 6
Volvo Group
Board members 1,017 15 1,010 10 939 11
Presidents and other senior executives 1,276 16 1,305 16 1,422 15