Volvo 2006 Annual Report Download - page 139
Download and view the complete annual report
Please find page 139 of the 2006 Volvo annual report below. You can navigate through the pages in the report by either clicking on the pages listed below, or by using the keyword search tool below to find specific information within the annual report.-
 1
1 -
2
-
3
-
4
-
5
-
6
-
7
-
8
-
9
-
10
-
11
-
12
-
13
-
14
-
15
-
16
-
17
-
18
-
19
-
20
-
21
-
22
-
23
-
24
-
25
-
26
-
27
-
28
-
29
-
30
-
31
-
32
-
33
-
34
-
35
-
36
-
37
-
38
-
39
-
40
-
41
-
42
-
43
-
44
-
45
-
46
-
47
-
48
-
49
-
50
-
51
-
52
-
53
-
54
-
55
-
56
-
57
-
58
-
59
-
60
-
61
-
62
-
63
-
64
-
65
-
66
-
67
-
68
-
69
-
70
-
71
-
72
-
73
-
74
-
75
-
76
-
77
-
78
-
79
-
80
-
81
-
82
-
83
-
84
-
85
-
86
-
87
-
88
-
89
-
90
-
91
-
92
-
93
-
94
-
95
-
96
-
97
-
98
-
99
-
100
-
101
-
102
-
103
-
104
-
105
-
106
-
107
-
108
-
109
-
110
-
111
-
112
-
113
-
114
-
115
-
116
-
117
-
118
-
119
-
120
-
121
-
122
-
123
-
124
-
125
-
126
-
127
-
128
-
 129
129 -
 130
130 -
 131
131 -
 132
132 -
 133
133 -
 134
134 -
 135
135 -
 136
136 -
 137
137 -
 138
138 -
 139
139 -
 140
140 -
 141
141 -
 142
142 -
 143
143 -
 144
144 -
 145
145 -
 146
146 -
 147
147 -
 148
148 -
 149
149 -
150
-
151
-
152
-
153
-
154
-
155
-
156
-
157
-
158
-
159
-
160
-
161
-
162
-
163
-
164
-
165
-
166
-
167
-
168
-
169
-
170
 |
 |

Financial information 2006 135
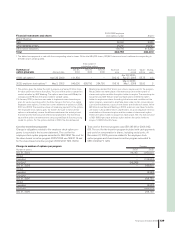
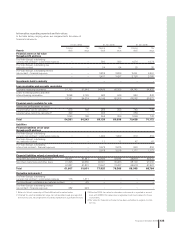
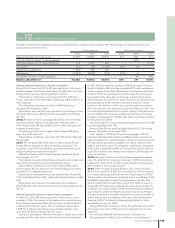
31 dec, 2004 31 dec, 2005 31 dec, 2006
Carying Fair Carying Fair Carying Fair
Assets value value value value value value
Financial assets at fair value
through profi t and loss
The Volvo Group’s outstanding
currency risk contract – commercial exposure – – 560 560 1,074 1,074
The Volvo Group’s outstanding raw
materials contract – – 54 54 25 25
The Volvo Group’s outstanding interest
risk contract – fi nancial exposure – – 2,823 2,823 2,661 2,661
– – 3,437 3,437 3,760 3,760
Investments held to maturity – – – – – –
Loan receivables and accounts receivables
Customer fi nancing receivables 51,193 51,948 64,466 65,365 64,742 64,832
Loans to external parties and other
interest-bearing receivables 2,098 2,126 680 643 840 840
53,291 54,074 65,146 66,008 65,582 65,672
Financial assets available for sale
Shares and participations for which:
a market value can be calculated
1 670 169 253 253 740 740
a market value cannot be calculated
2 420 – 303 – 356 –
1,090 169 556 253 1,096 740
Total 54,381 54,243 69,139 69,698 70,438 70,172
Liabilities
Financial liabilities at fair value
through profi t and loss
The Volvo Group’s outstanding
currency risk contract – commercial exposure – – 1,292 1,292 310 310
The Volvo Group’s outstanding
raw materials contract – – 11 11 47 47
The Volvo Group’s outstanding
interest risk contract - fi nancial exposure – – 2,675 2,675 820 820
– – 3,978 3,978 1,177 1,177
Financial liabilities valued at amortized cost
Long-term bond loans and other loans 40,411 41,441 43,626 43,944 38,818 40,575
Short-term bank loans and other loans 21,396 20,360 30,321 30,463 28,100 27,032
61,807 61,801 73,947 74,407 66,918 67,607
Total 61,807 61,801 77,925 78,385 68,095 68,784
Derivative instruments
3
The Volvo Group’s outstanding
currency risk contract – commercial exposure 176 1,371 – – – –
The Volvo Group’s outstanding raw materials contract – –25 – – – –
The Volvo Group’s outstanding interest
risk contract – fi nancial exposure 252 924 – – – –
1 Refers to Volvo’s ownership of Deutz AG valued to market value.
2 Unlisted for which a reliable fair value can not be determined, are reported
at a historic cost. No single block of shares represents a signifi cant amount.
3 Effective 2005, fair value for derivative instruments is reported in accord-
ance with IAS39. Fair values are in agreement with book values for these
instruments.
4 Fair value for fi n ancial instruments has been estimated in regards to inter-
est risk.
Information regarding reported and fair values
In the table below, carrying values are compared with fair values of
fi n a ncial instruments.