Volvo 2006 Annual Report Download - page 168
Download and view the complete annual report
Please find page 168 of the 2006 Volvo annual report below. You can navigate through the pages in the report by either clicking on the pages listed below, or by using the keyword search tool below to find specific information within the annual report.-
 1
1 -
2
-
3
-
4
-
5
-
6
-
7
-
8
-
9
-
10
-
11
-
12
-
13
-
14
-
15
-
16
-
17
-
18
-
19
-
20
-
21
-
22
-
23
-
24
-
25
-
26
-
27
-
28
-
29
-
30
-
31
-
32
-
33
-
34
-
35
-
36
-
37
-
38
-
39
-
40
-
41
-
42
-
43
-
44
-
45
-
46
-
47
-
48
-
49
-
50
-
51
-
52
-
53
-
54
-
55
-
56
-
57
-
58
-
59
-
60
-
61
-
62
-
63
-
64
-
65
-
66
-
67
-
68
-
69
-
70
-
71
-
72
-
73
-
74
-
75
-
76
-
77
-
78
-
79
-
80
-
81
-
82
-
83
-
84
-
85
-
86
-
87
-
88
-
89
-
90
-
91
-
92
-
93
-
94
-
95
-
96
-
97
-
98
-
99
-
100
-
101
-
102
-
103
-
104
-
105
-
106
-
107
-
108
-
109
-
110
-
111
-
112
-
113
-
114
-
115
-
116
-
117
-
118
-
119
-
120
-
121
-
122
-
123
-
124
-
125
-
126
-
127
-
128
-
129
-
130
-
131
-
132
-
133
-
134
-
135
-
136
-
137
-
138
-
139
-
140
-
141
-
142
-
143
-
144
-
145
-
146
-
147
-
148
-
149
-
150
-
151
-
152
-
153
-
154
-
155
-
156
-
157
-
 158
158 -
 159
159 -
 160
160 -
 161
161 -
 162
162 -
 163
163 -
 164
164 -
 165
165 -
 166
166 -
 167
167 -
 168
168 -
 169
169 -
 170
170
 |
 |

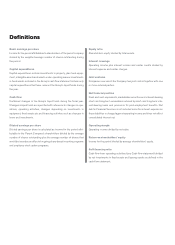
Definitions
Basic earnings per share
Income for the period attributable to shareholders of the parent company
divided by the weighted average number of shares outstanding during
the period.
Capital expenditures
Capital expenditures include investments in property, plant and equip-
ment, intangible assets and assets under operating leases. Investments
in fixed assets included in the Group’s cash flow statement include only
capital expenditures that have reduced the Group’s liquid funds during
the year.
Cash-flow
Combined changes in the Group’s liquid funds during the fiscal year.
Changes inliquid funds are specified with reference to changes in ope-
rations, operating activities, changes depending on investments in
equipment, fixed assets etc and financing acitivites such as changes in
loans and investments.
Diluted earnings per share
Diluted earnings per share is calculated as income for the period attri-
butable to the Parent Company’s shareholders divided by the average
number of shares outstanding plus the average number of shares that
would be issued as an effect of ongoing share-based incentive programs
and employee stock option programs.
Equity ratio
Shareholders’ equity divided by total assets.
Interest coverage
Operating income plus interest income and similar credits divided by
interest expense and similar charges.
Joint ventures
Companies over which the Company has joint control together with one
or more external parties.
Net financial position
Cash and cash equivalents, marketable securities and interest-bearing
short- and long-term receivables reduced by short- and long-term inte-
rest-bearing loans and provisions for post-employment benefits. Net
debt in Financial Services is not included since the interest expense on
these liabilities is charged against operating income and does not affect
consolidated interest net.
Operating margin
Operating income divided by net sales.
Return on shareholders’ equity
Income for the period divided by average shareholders’ equity.
Self-financing ratio
Cash-flow from operating activities (see Cash-flow statement) divided
by net investments in fixed assets and leasing assets as defined in the
cash-flow statement.