Volvo 2006 Annual Report Download - page 135
Download and view the complete annual report
Please find page 135 of the 2006 Volvo annual report below. You can navigate through the pages in the report by either clicking on the pages listed below, or by using the keyword search tool below to find specific information within the annual report.-
 1
1 -
2
-
3
-
4
-
5
-
6
-
7
-
8
-
9
-
10
-
11
-
12
-
13
-
14
-
15
-
16
-
17
-
18
-
19
-
20
-
21
-
22
-
23
-
24
-
25
-
26
-
27
-
28
-
29
-
30
-
31
-
32
-
33
-
34
-
35
-
36
-
37
-
38
-
39
-
40
-
41
-
42
-
43
-
44
-
45
-
46
-
47
-
48
-
49
-
50
-
51
-
52
-
53
-
54
-
55
-
56
-
57
-
58
-
59
-
60
-
61
-
62
-
63
-
64
-
65
-
66
-
67
-
68
-
69
-
70
-
71
-
72
-
73
-
74
-
75
-
76
-
77
-
78
-
79
-
80
-
81
-
82
-
83
-
84
-
85
-
86
-
87
-
88
-
89
-
90
-
91
-
92
-
93
-
94
-
95
-
96
-
97
-
98
-
99
-
100
-
101
-
102
-
103
-
104
-
105
-
106
-
107
-
108
-
109
-
110
-
111
-
112
-
113
-
114
-
115
-
116
-
117
-
118
-
119
-
120
-
121
-
122
-
123
-
124
-
 125
125 -
 126
126 -
 127
127 -
 128
128 -
 129
129 -
 130
130 -
 131
131 -
 132
132 -
 133
133 -
 134
134 -
 135
135 -
 136
136 -
 137
137 -
 138
138 -
 139
139 -
 140
140 -
 141
141 -
 142
142 -
 143
143 -
 144
144 -
 145
145 -
146
-
147
-
148
-
149
-
150
-
151
-
152
-
153
-
154
-
155
-
156
-
157
-
158
-
159
-
160
-
161
-
162
-
163
-
164
-
165
-
166
-
167
-
168
-
169
-
170
 |
 |

Financial information 2006 131
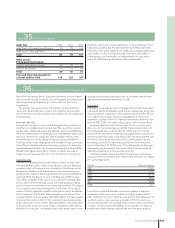
Note 35 Fees to the auditors
Audit fees 2004 2005 2006
Audit fees to PricewaterhouseCoopers 78 78 130
Audit fees to other audit fi rms 2 1 1
Total 80 79 131
Other fees to
PricewaterhouseCoopers
Fees for audit related services 20 28 20
Fees for tax services 16 17 14
Total 36 45 34
Fees and other remuneration to
external auditors total 116 124 165
Auditing assignments involve examination of the annual report and
fi n a ncial accounting and the administration by the Board and the
President, other tasks related to the duties of a company auditor and
consultation or other services that may result from observations
noted during such examination or implementation of such other
tasks. All other tasks are defi ned as other assignments.
Not 36 Goals and policies in fi nancial risk management
Apart from derivatives, Volvo’s fi nancial instruments consist of bank
loans, fi n ancial leasing contracts, accounts payable, accounts receiv-
able, shares and participations, as well as cash and short-term
investments.
The primary risks deriving from the handling of fi nancial instru-
ments are interest-rate risk, currency risk, liquidity risk and credit
risk. All of these risks are handled in accordance with an established
fi n a ncial policy.
Interest-rate risk
Interest-rate risk refers to the risk that changed interest-rate levels
will affect consolidated earnings and cash fl ow (cash-fl ow risks) or
the fair value of fi nancial assets and liabilities (price risks). Matching
the interest-fi xing terms of fi n ancial assets and liabilities reduces the
exposure. Interest-rate swaps are used to change/infl uence the
interest-fi xing term for the Group’s fi nancial assets and liabilities.
Currency interest-rate swaps permit borrowing in foreign currencies
from different markets without introducing currency risk. Volvo also
has standardized interest-rate forward contracts (futures) and FRAs
(forward-rate agreements). Most of these contracts are used to
hedge interest-rate levels for short-term borrowing or investment.
Cash-fl ow risks
The effect of changed interest-rate levels on future currency and
interest-rate fl o ws refers mainly to the Group’s customer fi n ancing
operations and net fi n ancial items. According to the Group’s policy,
the degree of matching for interest-rate fi x ing on borrowing and
lending in the customer-fi nancing operations must exceed 80%. At
year-end 2006, the degree of such matching was 100%. At year-
end 2006, in addition to the assets in its customer-fi nancing oper-
ations, Volvo’s interest-bearing assets consisted primarily of liquid
assets invested in short-term interest-bearing securities. The object-
ive is to achieve an interest-fi xing term of six months for the liquid
assets in Volvo’s industrial operations through the use of derivatives.
On December 31, 2006, after taking derivatives into account, the
average interest on these assets was 3.5%. Apart from loans raised
to fi nance the credit portfolio of the customer-fi nancing operations,
at this same point in time, Volvo’s fi nancial liabilities consisted primar-
ily of provisions for pensions and similar commitments. After taking
derivatives into account, outstanding loans had interest terms corre-
sponding to an interest-rate fi x ing term of six months and the aver-
age interest at year-end amounted to 6.3%.
Price risks
Exposure to price risks as result of changed interest-rate levels refers
to fi nancial assets and liabilities with a lower interest-rate fi x ing term
(fi x ed interest). A comparison of the reported values and the fair val-
ues of all of Volvo’s fi n ancial assets and liabilities, as well as its
derivatives, is given in Note 37, Financial instruments. After the tran-
sition to IFRS 2005, the market values agree with the book values.
Assuming that the market interest rates for all currencies sud-
denly rose by one percentage point (100 interest-rate points) over
the interest-rate level on December 31, 2006, over a 12-month
period, all other variables remaining unchanged, Volvo’s net interest
income would be favorably impacted by 236. Assuming that the mar-
ket interest rates for all currencies fell in a similar manner by one
percentage point (100 interest-rate points) over the interest-rate
level on December 31, 2006, over a 12-month period, all other vari-
ables remaining unchanged, Volvo’s net interest income would be
adversely impacted by a corresponding amount.
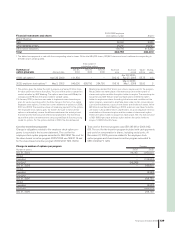
The following table shows the effect on earnings in Volvo’s key
currencies that would result is the interest-rate level were to change
by 1 percentage point.
SEK M Effect on earnings
SEK 314.9
USD (1.0)
EUR (17.1)
CAD (9.2)
JPY (8.8)
KRW 13.1
It should be noted that the above sensitivity analysis is based on
assumptions that rarely occur in reality. In reality, market interest
rates usually do not rise or fall at any one point in time. Moreover, the
sensitivity analysis also assumes a parallel shift in the yield curve
and an identical effect of changed market interest rates on the inter-
est-rates of both assets and liabilities. Consequently, the effect of
actual interest-rate changes may deviate from the above analysis.