Volvo 2006 Annual Report Download - page 41
Download and view the complete annual report
Please find page 41 of the 2006 Volvo annual report below. You can navigate through the pages in the report by either clicking on the pages listed below, or by using the keyword search tool below to find specific information within the annual report.-
 1
1 -
2
-
3
-
4
-
5
-
6
-
7
-
8
-
9
-
10
-
11
-
12
-
13
-
14
-
15
-
16
-
17
-
18
-
19
-
20
-
21
-
22
-
23
-
24
-
25
-
26
-
27
-
28
-
29
-
30
-
 31
31 -
 32
32 -
 33
33 -
 34
34 -
 35
35 -
 36
36 -
 37
37 -
 38
38 -
 39
39 -
 40
40 -
 41
41 -
 42
42 -
 43
43 -
 44
44 -
 45
45 -
 46
46 -
 47
47 -
 48
48 -
 49
49 -
 50
50 -
 51
51 -
52
-
53
-
54
-
55
-
56
-
57
-
58
-
59
-
60
-
61
-
62
-
63
-
64
-
65
-
66
-
67
-
68
-
69
-
70
-
71
-
72
-
73
-
74
-
75
-
76
-
77
-
78
-
79
-
80
-
81
-
82
-
83
-
84
-
85
-
86
-
87
-
88
-
89
-
90
-
91
-
92
-
93
-
94
-
95
-
96
-
97
-
98
-
99
-
100
-
101
-
102
-
103
-
104
-
105
-
106
-
107
-
108
-
109
-
110
-
111
-
112
-
113
-
114
-
115
-
116
-
117
-
118
-
119
-
120
-
121
-
122
-
123
-
124
-
125
-
126
-
127
-
128
-
129
-
130
-
131
-
132
-
133
-
134
-
135
-
136
-
137
-
138
-
139
-
140
-
141
-
142
-
143
-
144
-
145
-
146
-
147
-
148
-
149
-
150
-
151
-
152
-
153
-
154
-
155
-
156
-
157
-
158
-
159
-
160
-
161
-
162
-
163
-
164
-
165
-
166
-
167
-
168
-
169
-
170
 |
 |
In order to improve air quality, gov-
ernments in many countries are making
increasingly stringent demands for the
reduction of emissions, primarily nitro-
gen oxides and particulates. New,
stricter emission laws were introduced
in the EU on October 1, 2006 and in the
USA on January 1, 2007 for trucks and
buses. Even stricter requirements will be intro-
duced in a few years’ time. To meet these
requirements, the Volvo Group is continuously
developing new engine technology to minimise
fuel consumption and emissions. The primary
focus of this development work is on diesel
engines.
One of the most
im portant environmen-
tal issues is climate
change, which affects
all aspects of society.
The way in which cli-
mate issues are hand-
led will impact strongly
on glob al development.
Rising carbon dioxide
levels in the atmosphere are primarily caused
by the combustion of fossil fuels from oil, coal
and natural gas. The transport sector is
responsible for roughly 25% of fossil fuel con-
sumption, and for 25% of carbon dioxide emis-
sions. Road traffic is responsible for approxi-
mately 15%.
Climate change and access to energy
sources may strongly affect the Volvo Group. It
is therefore vital to prepare for the use of fuels
138 M and is the second stage in a total invest-
ment of SEK 650 M in the paintshop. The
investment will improve quality, cost and envir-
onmental performance.
The Volvo Group’s activities generate trans-
portation to and from production facilities. The
Group’s logistics managers regularly review
these flows and continuously make improve-
ments to considerably cut the amount of trans-
portation and facilitate a significant reduction
in total environmental impact. To assess the
environmental impact, Volvo Logistics has
developed a system for calculating environ-
mental load.
The existence of polluted land on properties
owned by the Volvo Group is cataloged every
year. This pollution generally has historic
origins. In 2006, cleaning-up activities were
conducted on six properties.
During 2006 there were no significant envir-
onmental incidents and there were no environ-
mental disputes.
For detailed environmental information about
the Volvo Group’s facilities, see page 161.
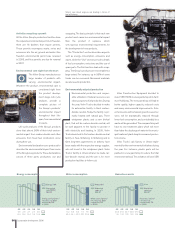
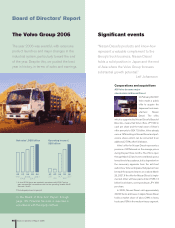
During use
The greatest environmental impact caused by
the Volvo Group’s products occurs during use.
The Volvo Group primarily uses diesel
engines in its products due to their high energy
efficiency and low emissions.
Improved fuel efficiency is a
highly effective way of reducing
carbon-dioxide emissions and cutting costs
for customers.
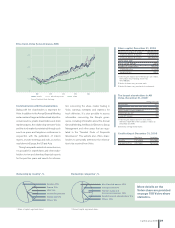
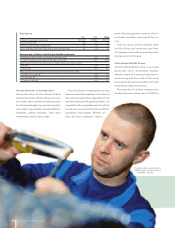
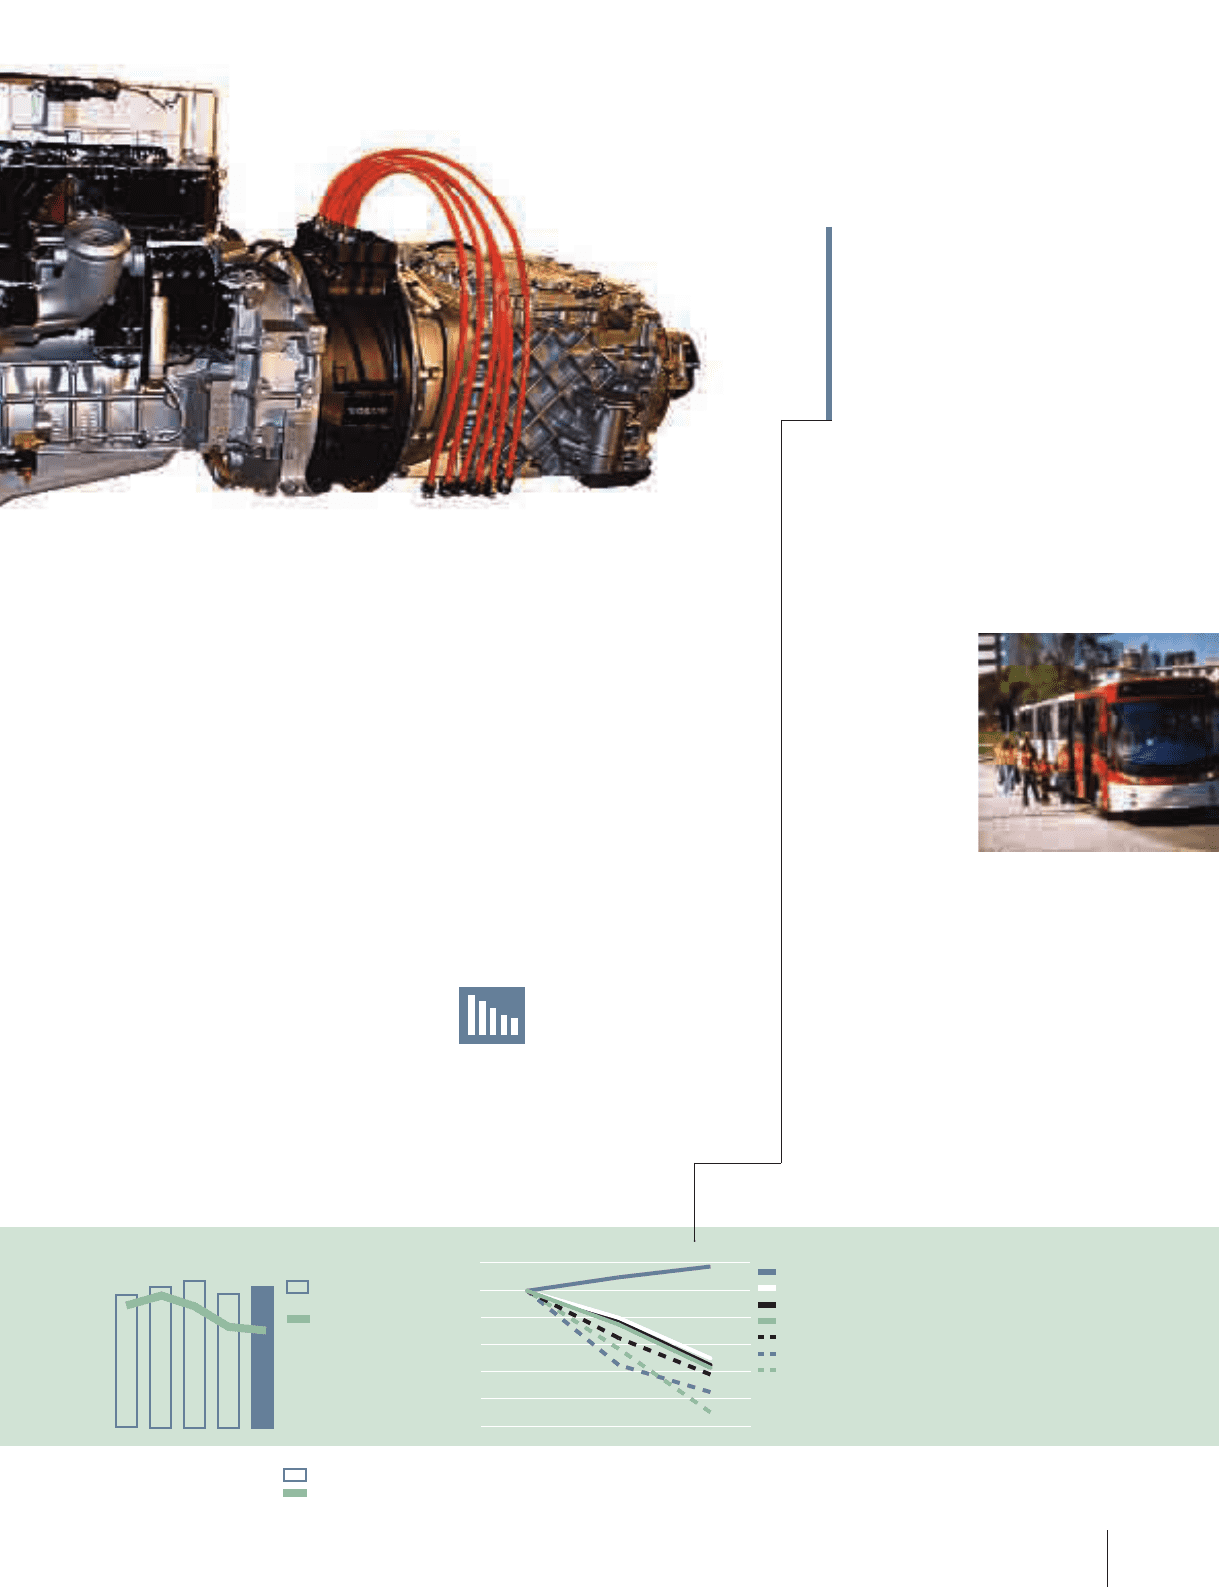
Solvent emission
1.9
05
2.0
06
2.0
03
1.9
Emissions,
k ton
Emission/net
sales kg/
SEK M
Solvent emissions/
net sales has been
reduced by 2%
in 2006.
02
2.1
8.5 8.311.210.7 10.3
04
2000
0
20
60
40
80
120
100
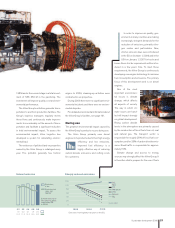
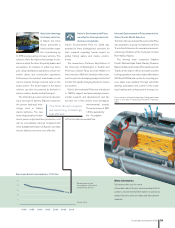
Emissions from highway transports in the EU.
1995 2006
CO
VOC
NOx
Bensen
CO2
SO2
PM-diesel
Source: ACEA
Sharply reduced emissions
Sustainable development 2006 37