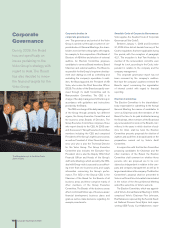
Volvo 2006 Annual Report Download - page 81
Download and view the complete annual report
Please find page 81 of the 2006 Volvo annual report below. You can navigate through the pages in the report by either clicking on the pages listed below, or by using the keyword search tool below to find specific information within the annual report.-
 1
1 -
2
-
3
-
4
-
5
-
6
-
7
-
8
-
9
-
10
-
11
-
12
-
13
-
14
-
15
-
16
-
17
-
18
-
19
-
20
-
21
-
22
-
23
-
24
-
25
-
26
-
27
-
28
-
29
-
30
-
31
-
32
-
33
-
34
-
35
-
36
-
37
-
38
-
39
-
40
-
41
-
42
-
43
-
44
-
45
-
46
-
47
-
48
-
49
-
50
-
51
-
52
-
53
-
54
-
55
-
56
-
57
-
58
-
59
-
60
-
61
-
62
-
63
-
64
-
65
-
66
-
67
-
68
-
69
-
70
-
 71
71 -
 72
72 -
 73
73 -
 74
74 -
 75
75 -
 76
76 -
 77
77 -
 78
78 -
 79
79 -
 80
80 -
 81
81 -
 82
82 -
 83
83 -
 84
84 -
 85
85 -
 86
86 -
 87
87 -
 88
88 -
 89
89 -
 90
90 -
 91
91 -
92
-
93
-
94
-
95
-
96
-
97
-
98
-
99
-
100
-
101
-
102
-
103
-
104
-
105
-
106
-
107
-
108
-
109
-
110
-
111
-
112
-
113
-
114
-
115
-
116
-
117
-
118
-
119
-
120
-
121
-
122
-
123
-
124
-
125
-
126
-
127
-
128
-
129
-
130
-
131
-
132
-
133
-
134
-
135
-
136
-
137
-
138
-
139
-
140
-
141
-
142
-
143
-
144
-
145
-
146
-
147
-
148
-
149
-
150
-
151
-
152
-
153
-
154
-
155
-
156
-
157
-
158
-
159
-
160
-
161
-
162
-
163
-
164
-
165
-
166
-
167
-
168
-
169
-
170
 |
 |

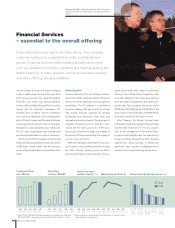
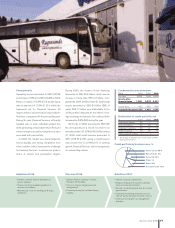
Strong results
Operating income amounted to SEK 2,301 M ,
an increase of 13% from SEK 2,033 M in 2005.
Return on equity of 15.5% (15.3) and an equity
ratio at year-end of 11.5% (11.2) is within the
framework set for Financial Services. All
regions within customer finance improved per-
formance compared with the preceeding year.
During the year, Financial Services efficiently
handled risks in each individual product line
while generating a reasonable return. Reduced
interest margins caused by rising interest rates
were dealt with successfully.
In 2006, the market was characterized by
excess liquidity and strong competition from
other creditors, which increased the challenge
for Financial Services to achieve set goals in
terms of volume and penetration targets.
During 2006, the volume of new financing
amounted to SEK 35.3 billion, which was an
increase of more than SEK 2.2 billion, com-
pared with 2005. On December 31, 2006, total
assets amounted to SEK 84 billion (86), of
which SEK 77 billion was attributable to the
credit portfolio. Adjusted for the effects of for-
eign exchange movements, the credit portfolio
increased by 5.3% (9.6) during the year.
Write-offs in 2006 amounted to SEK 259
M, corresponding to a record low level to an
annualized ratio of 0.33% (0.40). On December
31, 2006, total credit reserves amounted to
SEK 1,578 M (1,751), giving a credit-reserve
ratio at year-end of 2.01% (2.17). In seeking
growth, Financial Services will not compromize
its underwriting criteria.
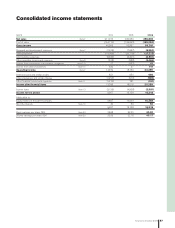
Condensed income statement
SEK M 2004 2005 2006
Net sales 9,598 7,549 8,969
Income after
financial items 1,365 2,033 2,301
Income taxes –430 –609 –756
Income for the period 935
1,424 1,545
Distribution of credit portfolio, net
% 2004 2005 2006
Operational leasing1 20 1 0
Financial leasing1 25 40 40
Installment contracts 38 41 42
Dealer financing 16 17 17
Other customer credits 1 1 1
1 The change in 2005 pertains to the impact of IFRS
leasing classification.
• Opened finance company in China,
Hungary and Slovakia.
• Focus on interest margins and risk
management.
• Financing at very low cost and strong
liquidity.
• Improve customer satisfaction.
• Enhance employee recruitment, develop-
ment and retention activities.
• Execute on market growth plus fee income
opportunities.
• Use better technology and processes to
improve productivity and customer service.
• Continued to sharpen risk management
activities.
• Expand customer finance operations in
growth markets.
• Closely monitor and adapt operations to
economic conditions.
• Maintain low costs for funding the Group’s
operations.
Outcome 2006 Ambitions 2007Ambitions 2006
Volvo Trucks 48%
Mack Trucks 9%
Volvo CE 22%
Other 1%
Buses 5%
Renault Trucks 15%
Credit portfolio by business area, %
Business areas 2006 77