Volvo 2006 Annual Report Download - page 112
Download and view the complete annual report
Please find page 112 of the 2006 Volvo annual report below. You can navigate through the pages in the report by either clicking on the pages listed below, or by using the keyword search tool below to find specific information within the annual report.-
 1
1 -
2
-
3
-
4
-
5
-
6
-
7
-
8
-
9
-
10
-
11
-
12
-
13
-
14
-
15
-
16
-
17
-
18
-
19
-
20
-
21
-
22
-
23
-
24
-
25
-
26
-
27
-
28
-
29
-
30
-
31
-
32
-
33
-
34
-
35
-
36
-
37
-
38
-
39
-
40
-
41
-
42
-
43
-
44
-
45
-
46
-
47
-
48
-
49
-
50
-
51
-
52
-
53
-
54
-
55
-
56
-
57
-
58
-
59
-
60
-
61
-
62
-
63
-
64
-
65
-
66
-
67
-
68
-
69
-
70
-
71
-
72
-
73
-
74
-
75
-
76
-
77
-
78
-
79
-
80
-
81
-
82
-
83
-
84
-
85
-
86
-
87
-
88
-
89
-
90
-
91
-
92
-
93
-
94
-
95
-
96
-
97
-
98
-
99
-
100
-
101
-
 102
102 -
 103
103 -
 104
104 -
 105
105 -
 106
106 -
 107
107 -
 108
108 -
 109
109 -
 110
110 -
 111
111 -
 112
112 -
 113
113 -
 114
114 -
 115
115 -
 116
116 -
 117
117 -
 118
118 -
 119
119 -
 120
120 -
 121
121 -
 122
122 -
123
-
124
-
125
-
126
-
127
-
128
-
129
-
130
-
131
-
132
-
133
-
134
-
135
-
136
-
137
-
138
-
139
-
140
-
141
-
142
-
143
-
144
-
145
-
146
-
147
-
148
-
149
-
150
-
151
-
152
-
153
-
154
-
155
-
156
-
157
-
158
-
159
-
160
-
161
-
162
-
163
-
164
-
165
-
166
-
167
-
168
-
169
-
170
 |
 |

108 Financial information 2006
The Volvo Group
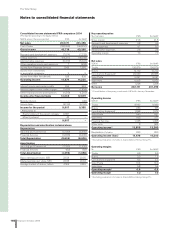
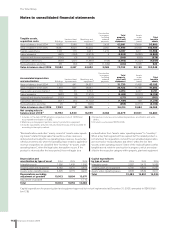
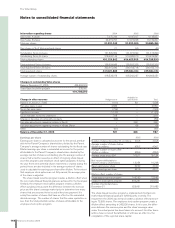
Notes to consolidated financial statements
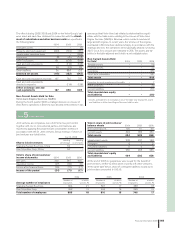
Investments in associated
companies 2004 2005 2006
Trucks 37 47 5,498
Buses 20 35 43
Construction Equipment – – –
Volvo Penta – – –
Volvo Aero 37 3 1
Financial Services 172 23 24
Other 647 87 228
Volvo Group total 913 195 5,794
Trucks 2006 includes investment in Nissan Diesel of SEK 5,445 M.
Capital expenditures 2004 2005 2006
Trucks 5,030 7,190 6,260
Buses 176 250 263
Construction Equipment 1,158 906 1,580
Volvo Penta 297 243 248
Volvo Aero 801 904 843
Other 237 762 402
Volvo Group excl
Financial Services 7,699 10,255 9,596
Financial Services 4,784 386 999
Reclassifi cation Group versus
segment Financial Services – 4,210 3,439
Volvo Group total 12,483 14,851 14,034
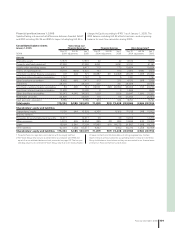
Reporting by geographical segment
Net sales 2004 2005 2006
Europe 119,077 124,023 138,342
North America 54,769 69,743 74,928
South America 7,338 12,479 13,159
Asia 20,789 22,699 19,655
Other markets 9,103 11,615 12,751
Volvo Group total* 211,076 240,559 258,835
*of which:
Sweden 14,606 15,334 13,805
United States 45,926 59,254 61,793
France 26,900 27,610 31,155
Total assets 2004 2005 2006
Sweden 79,578 86,865 81,173
Europe excluding Sweden 77,909 86,530 91,163
North America 48,165 60,846 58,444
South America 6,526 10,131 10,766
Asia 7,757 9,460 11,512
Other markets 4,033 3,375 5,369
Volvo Group total 223,968 257,207 258,427
Capital expenditures 2004 2005 2006
Sweden 3,690 5,935 3,970
Europe excluding Sweden 6,305 5,770 7,395
North America 1,835 2,451 1,851
South America 247 296 280
Asia 362 259 421
Other markets 44 140 117
Volvo Group total 12,483 14,851 14,034
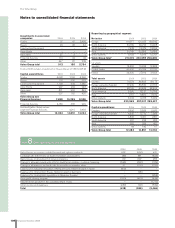
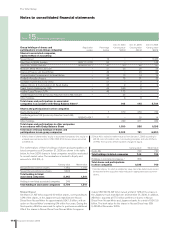
Note 8 Other operating income and expenses
2004 2005 2006
Gains/losses on currency related forward and options contracts 828 (566) 481
Exchange rate differences on trade receivables and payables (86) 481 (825)
Gains/losses on divestment of group companies 69 697 286
Change in allowances and write offs for doubtful receivables, customer fi n ancing (545) (460) (189)
Change in allowances, and write offs for doubtful receivables, other 37 (133) (273)
Expenses for industrial relocation of Renault Trucks Villaverde plant in Spain (470) – –
Expenses for closing Volvo Buses Heilbronn plant in Germany – (95) –
Expenses for closing Volvo operations in Bromma, Sweden – – (258)
Volvo profi t sharing program (200) (419) (444)
Adjustment of goodwill in the subsidiary Mack Trucks – – (1,712)
Other income and expenses (250) (93) (532)
Total (618) (588) (3,466)