Volvo 2006 Annual Report Download - page 124
Download and view the complete annual report
Please find page 124 of the 2006 Volvo annual report below. You can navigate through the pages in the report by either clicking on the pages listed below, or by using the keyword search tool below to find specific information within the annual report.-
 1
1 -
2
-
3
-
4
-
5
-
6
-
7
-
8
-
9
-
10
-
11
-
12
-
13
-
14
-
15
-
16
-
17
-
18
-
19
-
20
-
21
-
22
-
23
-
24
-
25
-
26
-
27
-
28
-
29
-
30
-
31
-
32
-
33
-
34
-
35
-
36
-
37
-
38
-
39
-
40
-
41
-
42
-
43
-
44
-
45
-
46
-
47
-
48
-
49
-
50
-
51
-
52
-
53
-
54
-
55
-
56
-
57
-
58
-
59
-
60
-
61
-
62
-
63
-
64
-
65
-
66
-
67
-
68
-
69
-
70
-
71
-
72
-
73
-
74
-
75
-
76
-
77
-
78
-
79
-
80
-
81
-
82
-
83
-
84
-
85
-
86
-
87
-
88
-
89
-
90
-
91
-
92
-
93
-
94
-
95
-
96
-
97
-
98
-
99
-
100
-
101
-
102
-
103
-
104
-
105
-
106
-
107
-
108
-
109
-
110
-
111
-
112
-
113
-
 114
114 -
 115
115 -
 116
116 -
 117
117 -
 118
118 -
 119
119 -
 120
120 -
 121
121 -
 122
122 -
 123
123 -
 124
124 -
 125
125 -
 126
126 -
 127
127 -
 128
128 -
 129
129 -
 130
130 -
 131
131 -
 132
132 -
 133
133 -
 134
134 -
135
-
136
-
137
-
138
-
139
-
140
-
141
-
142
-
143
-
144
-
145
-
146
-
147
-
148
-
149
-
150
-
151
-
152
-
153
-
154
-
155
-
156
-
157
-
158
-
159
-
160
-
161
-
162
-
163
-
164
-
165
-
166
-
167
-
168
-
169
-
170
 |
 |

120 Financial information 2006
The Volvo Group
Notes to consolidated financial statements
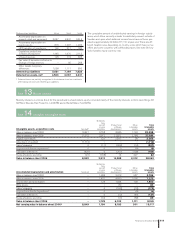
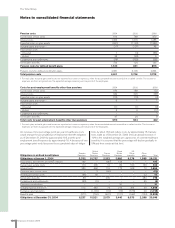
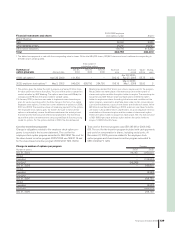
Pension costs 2004 2005 2006
Current year service costs 616 788 870
Interest costs 1,306 1,315 1,285
Expected return on plan assets (931) (1,133) (1,359)
Actuarial gains and losses
1 (17) (107) 48
Past service costs
– Unvested 7 (4) (56)
– Vested 38 (20) 0
Curtailments and settlements (28) (362) (28)
Termination benefi ts 729 124 135
Pension costs for defi ned benefi t plans 1,720 601 895
Pension costs for defi ned contribution plans 2,681 3,135 2,844
Total pension costs 4,401 3,736 3,739
1 For each plan, actuarial gains and losses are reported as income or expenses, when the accumulated amount exceeds the so called corridor. The income or
expenses are then recognized over the expected average remaining service period of the employees.
Costs for post-employment benefi ts other than pensions 2004 2005 2006
Current year service costs 196 188 132
Interest costs 349 323 348
Expected return on plan assets (12) (15) (4)
Actuarial gains and losses
1 6 1 1
Past service costs
– Unvested (1) (1) (9)
– Vested 5 4 (17)
Curtailments and settlements – – 3
Termination benefi ts 47 24 8
Total costs for post-employment benefi ts other than pensions 590 524 462
1 For each plan, actuarial gains and losses are reported as income or expenses, when the accumulated amount exceed the so called corridor. The income or
expenses are then recognized over the expected average remaining service period of the employees.
An increase of one percentage point per year in healthcare costs
would change the accumulated post-employment benefi t obligation
as of December 31, 2006 by approximately 193, and the post-
employment benefi t expense by approximately 18. A decrease of one
percentage point would decrease the accumulated value of obliga-
tions by about 164 and reduce costs by approximately 15. Calcula-
tions made as of December 31, 2006 show an annual increase of
10% in the weighted average per capita costs of covered healthcare
benefi ts; it is assumed that the percentage will decline gradually to
5% and then remain at that level.
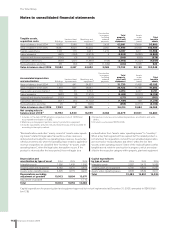
United Great US
Sweden States France Britain Other Other
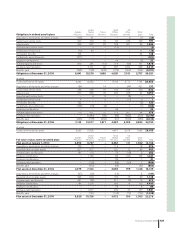
Obligations in defi ned benefi t plans Pensions Pensions Pensions Pensions benefi ts plans Total
Obligations at January 1, 2004 5,332 10,707 2,333 2,986 6,278 1,595 29,231
Acquisitions, divestments and other changes 140 – (85) 138 – – 193
Current year service costs 176 206 19 82 193 136 812
Interest costs 280 668 115 172 348 72 1,655
Unvested past service costs – 3 (66) – – – (63)
Vested past service costs (46) 66 – – – 22 42
Termination benefi ts 88 – 205 – – 483 776
Curtailments and settlements (35) (5) – – – 35 (5)
Employee contributions – – – 30 – 1 31
Actuarial (gains) and losses 573 683 74 215 364 39 1,948
Exchange rate translation – (1,103) (19) (76) (576) 29 (1,745)
Benefi ts paid (271) (704) (497) (101) (532) (124) (2,229)
Obligations at December 31, 2004 6,237 10,521 2,079 3,446 6,075 2,288 30,646