Volvo 2006 Annual Report Download - page 148
Download and view the complete annual report
Please find page 148 of the 2006 Volvo annual report below. You can navigate through the pages in the report by either clicking on the pages listed below, or by using the keyword search tool below to find specific information within the annual report.-
 1
1 -
2
-
3
-
4
-
5
-
6
-
7
-
8
-
9
-
10
-
11
-
12
-
13
-
14
-
15
-
16
-
17
-
18
-
19
-
20
-
21
-
22
-
23
-
24
-
25
-
26
-
27
-
28
-
29
-
30
-
31
-
32
-
33
-
34
-
35
-
36
-
37
-
38
-
39
-
40
-
41
-
42
-
43
-
44
-
45
-
46
-
47
-
48
-
49
-
50
-
51
-
52
-
53
-
54
-
55
-
56
-
57
-
58
-
59
-
60
-
61
-
62
-
63
-
64
-
65
-
66
-
67
-
68
-
69
-
70
-
71
-
72
-
73
-
74
-
75
-
76
-
77
-
78
-
79
-
80
-
81
-
82
-
83
-
84
-
85
-
86
-
87
-
88
-
89
-
90
-
91
-
92
-
93
-
94
-
95
-
96
-
97
-
98
-
99
-
100
-
101
-
102
-
103
-
104
-
105
-
106
-
107
-
108
-
109
-
110
-
111
-
112
-
113
-
114
-
115
-
116
-
117
-
118
-
119
-
120
-
121
-
122
-
123
-
124
-
125
-
126
-
127
-
128
-
129
-
130
-
131
-
132
-
133
-
134
-
135
-
136
-
137
-
 138
138 -
 139
139 -
 140
140 -
 141
141 -
 142
142 -
 143
143 -
 144
144 -
 145
145 -
 146
146 -
 147
147 -
 148
148 -
 149
149 -
 150
150 -
 151
151 -
 152
152 -
 153
153 -
 154
154 -
 155
155 -
 156
156 -
 157
157 -
 158
158 -
159
-
160
-
161
-
162
-
163
-
164
-
165
-
166
-
167
-
168
-
169
-
170
 |
 |

144 Financial information 2006
Parent Company AB Volvo
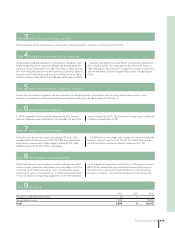
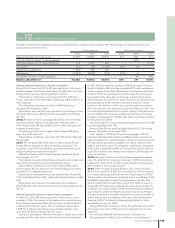
Note 11Intangible and tangible assets
Value in Value in Value in
balance sheet balance sheet Capital Sales/ balance sheet
Acquisition cost 2004 2005 expenditures scrapping 2006
Rights 52 52 – – 52
Total intangible assets 52 52 – – 52
Buildings 9 6 – 0 6
Land and land improvements 4 3 – – 3
Machinery and equipment 49 48 0 0 48
Total tangible assets 62 57 0 0 57
Value in Value in Value in Net carryng
balance sheet balance sheet Sales/ balance sheet value in balance
Accumulated depreciation 2004 2 2005 2 Depreciation 1 scrapping 2006 2 sheet 2006 3
Rights 52 52 – – 52 0
Total intangible assets 52 52 – – 52 0
Buildings 1 1 0 0 1 5
Land and land improvements – 0 0 – 0 3
Machinery and equipment 40 40 1 (1) 40 8
Total tangible assets 41 41 1 (1) 41 16
1 Including write-downs.
2 Including accumulated write-downs.
3 Acquisition value, less accumulated depreciation, amortization and write-
downs.
The assessed value of buildings was 3 (3; 5) and of land 2 (1; 2).
Capital expenditures in tangible assets amounted to 0 (0; 2). Capital
expenditures approved but not yet implemented at year-end 2006
amounted to 3 (0; 0).
The table below shows the principal reasons for the difference
between the corporate income tax (28%) and the tax for the period.
2004 2005 2006
Income before taxes 6,484 5,590 6,055
Income tax according to
applicable tax rate (28%) (1,815) (1,565) (1,695)
Capital gains 184 149 (102)
Non-taxable dividends 46 2,565 114
Non-taxable revaluations of
shareholdings (153) (2,358) (54)
Other non-deductible expenses 26 (24) (15)
Other non-taxable income 282 3 11
Adjustment of current taxes for
prior periods 92 – 35
Income taxes for the period (1,338) (1,230) (1,706)
Specifi cation of deferred
tax assets 2004 2005 2006
Tax-loss carryforwards 942 – –
Valuation allowance for doubtful receivables 1 1 1
Provision for post-employment benefi ts 154 177 196
Other deductible temporary differences 0 20 –
Other taxable temporary differences (110) – –
Deferred tax assets 987 198 197
Note 10 Income taxes
2004 2005 2006
Current taxes 92 (331) (1,075)
Deferred taxes (1,430) (899) (1)
Total income taxes (1,338) (1,230) (1,706)
Current taxes were distributed as follows:
Current taxes 2004 2005 2006
Current taxes for the period – (331) (1,740)
Adjustment of current taxes for
prior periods 92 – 35
Total current taxes 92 (331) (1,705)
Claims as a consequence of tax audit carried out previously for
which provisions are not deemed necessary amount to – (–; 135).
The amount is included in contingent liabilities.
Deferred taxes relate to estimated tax on the change in tax-loss
carryforwards and temporary differences. Deferred tax assets are
reported to the extent that it is probable that the amount can be
utilized against future taxable income.
Deferred taxes related to change in tax-loss carryforwards
amount to – (neg. 942; neg. 1,427) and to changes in other tempo-
rary differences to neg. 1 (43; neg. 3). Income taxes of 110 regard-
ing prior periods have been debited directly to equity in connection
with change of accounting principle on January 1, 2004.
Notes to financial statements