Volvo 2006 Annual Report Download - page 73
Download and view the complete annual report
Please find page 73 of the 2006 Volvo annual report below. You can navigate through the pages in the report by either clicking on the pages listed below, or by using the keyword search tool below to find specific information within the annual report.-
 1
1 -
2
-
3
-
4
-
5
-
6
-
7
-
8
-
9
-
10
-
11
-
12
-
13
-
14
-
15
-
16
-
17
-
18
-
19
-
20
-
21
-
22
-
23
-
24
-
25
-
26
-
27
-
28
-
29
-
30
-
31
-
32
-
33
-
34
-
35
-
36
-
37
-
38
-
39
-
40
-
41
-
42
-
43
-
44
-
45
-
46
-
47
-
48
-
49
-
50
-
51
-
52
-
53
-
54
-
55
-
56
-
57
-
58
-
59
-
60
-
61
-
62
-
 63
63 -
 64
64 -
 65
65 -
 66
66 -
 67
67 -
 68
68 -
 69
69 -
 70
70 -
 71
71 -
 72
72 -
 73
73 -
 74
74 -
 75
75 -
 76
76 -
 77
77 -
 78
78 -
 79
79 -
 80
80 -
 81
81 -
 82
82 -
 83
83 -
84
-
85
-
86
-
87
-
88
-
89
-
90
-
91
-
92
-
93
-
94
-
95
-
96
-
97
-
98
-
99
-
100
-
101
-
102
-
103
-
104
-
105
-
106
-
107
-
108
-
109
-
110
-
111
-
112
-
113
-
114
-
115
-
116
-
117
-
118
-
119
-
120
-
121
-
122
-
123
-
124
-
125
-
126
-
127
-
128
-
129
-
130
-
131
-
132
-
133
-
134
-
135
-
136
-
137
-
138
-
139
-
140
-
141
-
142
-
143
-
144
-
145
-
146
-
147
-
148
-
149
-
150
-
151
-
152
-
153
-
154
-
155
-
156
-
157
-
158
-
159
-
160
-
161
-
162
-
163
-
164
-
165
-
166
-
167
-
168
-
169
-
170
 |
 |

• The improvement program resulted in
increases efficiency in sales and the indus-
trial system globally.
• Production processes have been simplified
and result in shorter production times.
• All new engines for Euro 4/Euro 5 are in
production.
• Nearly 100 of Volvo Trucks’ service centers
in Europe were selected to also be able to
provide service for the buses’ bodies.
Ambitions 2006
• Continue the implementation of the earn-
ings-improvement program within Volvo
Buses.
• Shorten lead times from order to invoicing.
• Further strengthen positions in China and
India.
• All employees shall be involved in the
Operational Development program.
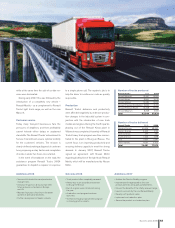
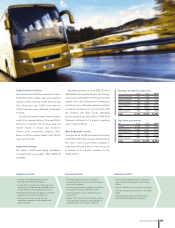
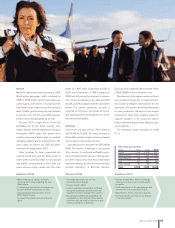
High deliveries in China
Volvo delivered 10,360 buses and bus chassis
(10,675) in 2006. Higher sales were reported
mainly in North America, South America and
Asia. During the year, 1,300 of an order for
2,000 midi-buses were delivered to Shanghai
in China.
Volvo Buses market shares were strength-
ened in, for example, Mexico, China and North
America. In contrast, the business area lost
market shares in Europe, due mostly to
intense price competition. However, Volvo
Buses is still the market leader in the Nordic
region and the UK.
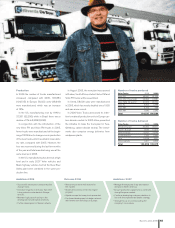
Improved earnings
Net sales in 2006 were largely unchanged
compared with a year earlier, SEK 16,856 M
(16,589).
Operating income rose from SEK 470 M to
SEK 633 M . Among other factors, the stronger
earnings are attributable to better product and
market mixes and increased cost awareness
resulting in more efficient production methods
as well as increased use of components that
are common with Volvo Trucks. Operating
income included a positive effect of SEK 47 M
following settlement of a dispute regarding
export credits in Brazil.
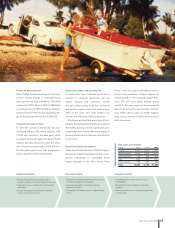
New body plant in India
Volvo produced 10,440 buses and bus chassis
(10,406) in 2006. The company decided during
the year to start a joint-venture company in
India that will build a plant in the country for
production of bus bodies, primarily for the
Indian market.
• Continue the implementation of the
earnings-improvement program.
• A reduction in product costs through such
measures as increased standardization and
enhancement of the production process.
• Renewal of the engine program to meet the
requirements of Euro 4 and Euro 5.
• Improved customer service through
expanded cooperation with dealers and
service centers.
Outcome 2006 Ambitions 2007
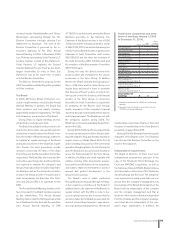
Number of vehicles delivered
2004 2005 2006
Western Europe 3,073 3,385 3,246
Eastern Europe 344 338 324
North America 1,388 1,546 1,741
South America 624 2,297 1,170
Asia 2,341 2,554 3,349
Other markets 462 555 530
Total 8,232 10,675 10,360
Net sales per market
Mkr 2004 2005 2006
Europe 6,948 7,142 7,509
North America 2,960 4,247 4,910
South America 521 2,641 1,537
Asia 1,632 1,612 2,003
Other markets 661 947 897
Total 12,722 16,589 16,856
Business areas 2006 69